


XRP (XRPUSD) Is down 2.45% on Aug 6: Here Is Why
XRP (XRPUSD) is down 2.45% at Aug 6 00:00(ET), now at $1.0433, with a 7-day down of 3.86%.
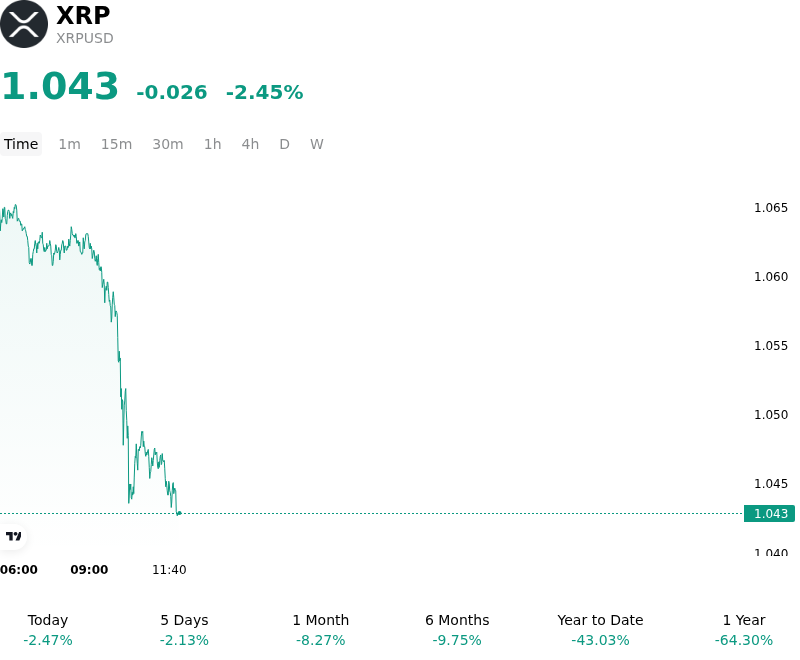
What is driving XRP (XRPUSD)’s stock price down today?
The recent retracement in XRP is primarily a function of a broader resurgence in the US dollar and a corresponding rise in long-dated Treasury yields, which has dampened appetite for high-beta digital assets. As global liquidity conditions tighten in response to hawkish signals from the Federal Reserve, institutional investors have shifted toward a defensive posture, reducing exposure to assets associated with cross-border payment volatility. This macro-driven rotation is particularly impactful for XRP given its role as a liquidity bridge, where fluctuations in fiat currency volatility directly influence the cost-efficiency of on-demand liquidity solutions.
Beyond macro factors, market sentiment has been weighed down by profit-taking following a period of sustained institutional accumulation. On-chain data indicates a slowdown in large-scale whale transactions, suggesting that major holders are moving to the sidelines ahead of upcoming regulatory milestones concerning global stablecoin frameworks. The lack of fresh catalysts regarding the integration of the XRP Ledger into regional central bank digital currency pilots has led to a temporary exhaustion of the bullish narrative that sustained prices in previous weeks.
From a derivatives perspective, the intraday volatility was intensified by a cluster of long liquidations across major exchanges. As the price broke below established technical support levels, the automated clearing of leveraged positions created a localized liquidity vacuum, forcing prices lower despite the absence of a fundamental shift in the network's long-term utility. The spike in the open interest-to-market cap ratio prior to the move suggests that the market was overly extended, leaving it vulnerable to even minor shifts in risk sentiment.
Furthermore, the ongoing scrutiny of secondary market trading practices by global regulators continues to provide a structural overhang. While XRP has achieved significant legal clarity in several jurisdictions, evolving compliance requirements for digital payment providers in emerging markets are forcing institutional participants to recalibrate their risk models. This regulatory friction, combined with a momentary dip in active address growth, has prompted a tactical exit by momentum-driven traders, contributing to the current downward pressure.
Technical Analysis of XRP (XRPUSD)
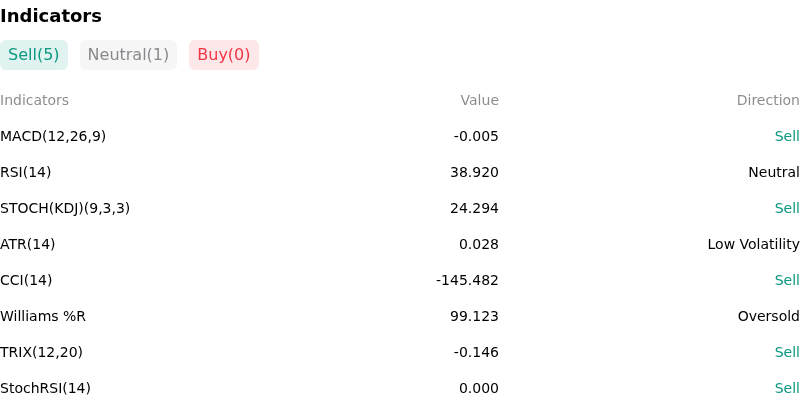
Technically, XRP (XRPUSD) shows a MACD (12,26,9) value of -0.005, indicating a sell signal. The RSI at 38.920 suggests neutral condition and the Williams %R at 99.123 suggests oversold condition. Please monitor closely.
More details about XRP (XRPUSD)
Recent Events and Risks:
- SEC Legal and Remedial Uncertainty: Ongoing litigation regarding the SEC’s motion for a final judgment and the determination of penalties for Ripple’s institutional sales continues to create significant overhead, as any unfavorable ruling on the "remedies" phase could lead to renewed selling pressure and legal appeals.
- Concentrated Exchange Inflows: Recent large-scale transfers of XRP from Ripple-affiliated wallets and escrow releases to liquid exchanges such as Bitstamp and Bitso indicate potential supply saturation, which historically precedes localized price retracements during periods of stagnant spot demand.
- Relative Liquidity Stagnation: While Bitcoin and Ethereum have benefited from specific institutional catalysts like ETF inflows, XRP faces a relative liquidity drain as capital rotates toward assets with clearer immediate regulatory status, leaving XRP vulnerable to volatility during sudden market-wide deleveraging events.
- Derivative Market Imbalance: A recent buildup in XRP long positions in the perpetual futures market, coupled with flat funding rates, suggests a lack of aggressive buying conviction, increasing the risk of a "long squeeze" if technical support levels are breached, potentially triggering a cascade of automated liquidations.
Recommended Articles


