


Solana (SOLUSD) Fluctuated Significantly on Aug 5: Key Variables Behind the Move
Solana (SOLUSD) is down 1.22% at Aug 5 09:35(ET), now at $72.38, with a 7-day up of 1.02%.
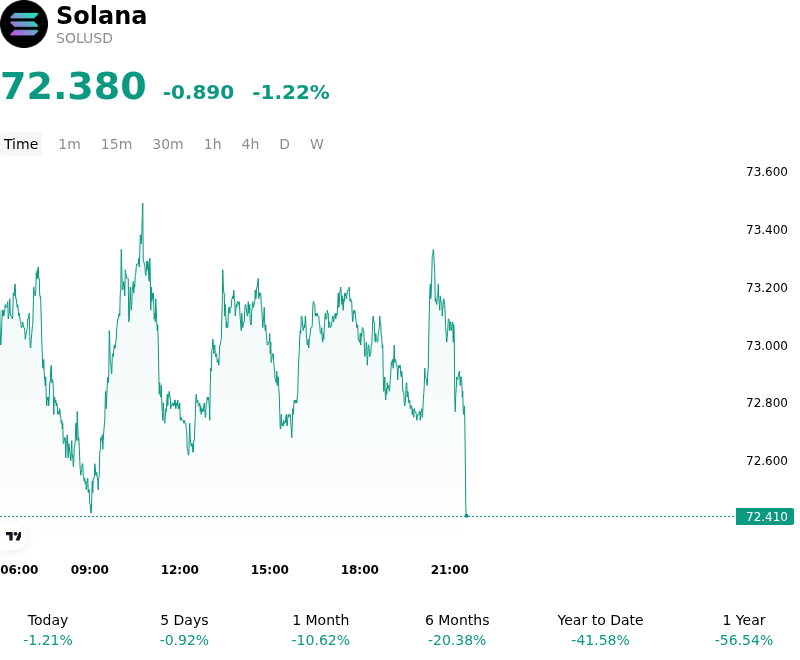
What is driving Solana (SOLUSD)’s stock price down today?
The recent intraday volatility in Solana reflects a broader de-risking trend across high-beta digital assets, primarily driven by a localized tightening of liquidity conditions and a slight resurgence in U.S. Treasury yields. As institutional investors recalibrate their exposure to Layer 1 ecosystems in response to shifting global macro expectations, Solana’s sensitivity to interest rate projections has come to the forefront. The upward movement in the U.S. Dollar Index has historically acted as a headwind for the asset, prompting a reduction in speculative positioning as market participants favor lower-risk environments.
On-chain metrics indicate a temporary deceleration in decentralized exchange volumes and a marginal decline in active addresses compared to the peak activity observed in prior sessions. This shift suggests a cooling of the momentum that has recently bolstered the ecosystem. Furthermore, institutional participation, particularly through spot-based investment vehicles, has signaled a period of consolidation. Any net outflows or slowing inflows into these products suggest that large-scale allocators are pausing to assess the durability of recent network upgrades and the competitive landscape of the smart contract sector.
The derivatives market has contributed to the price decline as a cluster of long positions was liquidated following a breach of immediate technical support levels. High funding rates observed in the preceding sessions had signaled an overcrowded long trade, leaving the market vulnerable to a leverage-driven flush. This volatility underscores the ongoing sensitivity of the asset to sudden shifts in market depth and liquidity, even as the long-term adoption narrative remains supported by developer activity and institutional pilot programs.
Regulatory uncertainty continues to influence investor sentiment and capital allocation strategies within the Layer 1 space. While Solana has established itself as a leader in transaction throughput and cost efficiency, the potential for increased oversight of staking mechanisms and decentralized finance protocols remains a monitored risk factor. Investors are currently navigating a balance between the asset's high growth potential and the macroeconomic risks associated with a potential slowdown in global liquidity expansion, leading to the current cautious stance.
Technical Analysis of Solana (SOLUSD)
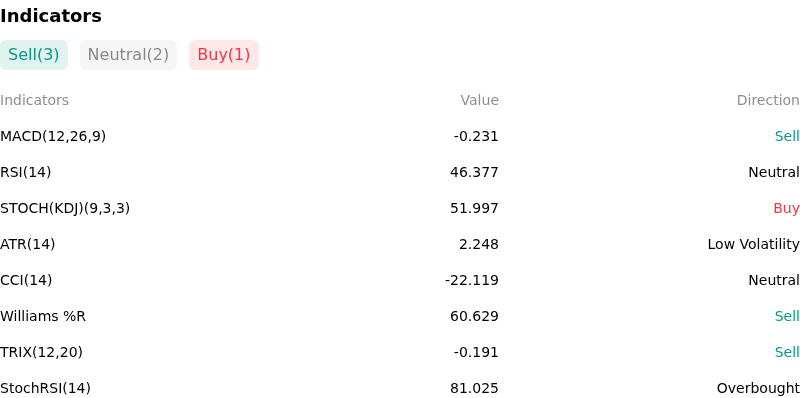
Technically, Solana (SOLUSD) shows a MACD (12,26,9) value of -0.231, indicating a sell signal. The RSI at 46.377 suggests neutral condition and the Williams %R at 60.629 suggests sell condition. Please monitor closely.
More details about Solana (SOLUSD)
Recent Events and Risks:
- Regulatory Hurdles and ETF Skepticism: Despite recent approvals for other digital asset products, institutional analysts have highlighted that Solana lacks a federally regulated futures market, a key SEC requirement for spot ETF approval; this realization has triggered a shift in sentiment and capital outflows from traders who had previously priced in a rapid Solana ETF timeline.
- FTX Estate Liquidation Pressure: On-chain monitoring has identified renewed transfers of SOL from FTX/Alameda-linked bankruptcy estate wallets to centralized exchanges; the ongoing necessity for the estate to liquidate assets for creditor distributions creates a persistent supply overhang that can stifle price recovery and exacerbate intraday downward volatility.
- Concentrated Validator and MEV Risk: Increasing concerns regarding Maximal Extractable Value (MEV) bot activity and high transaction failure rates during periods of peak demand continue to threaten network reliability; these technical bottlenecks discourage institutional dApp deployment and risk temporary capital flight toward more stable Layer 2 alternatives.
- Leverage Unwind and High Funding Rates: A buildup of long-biased open interest in the perpetual futures market has resulted in elevated funding rates, making it increasingly expensive for traders to maintain bullish positions; this market structure leaves the asset vulnerable to a "long squeeze" where a minor price dip triggers a cascade of automated liquidations.
Recommended Articles


