


XRP (XRPUSD) Is down 1.02% on Aug 5: Key Drivers to Watch
XRP (XRPUSD) is down 1.02% at Aug 5 00:05(ET), now at $1.0668, with a 7-day up of 0.09%.
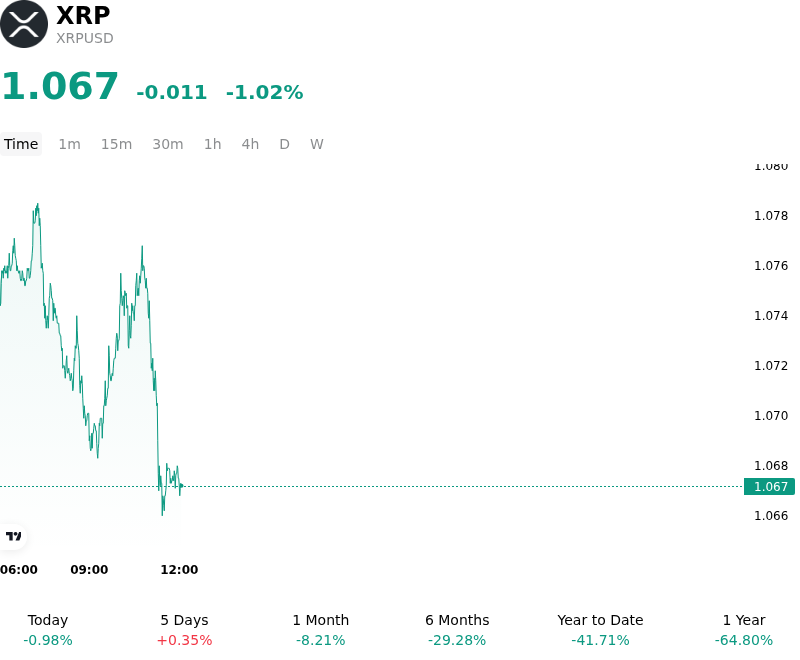
What is driving XRP (XRPUSD)’s stock price down today?
The decline in XRP is primarily attributed to a strengthening US Dollar and a marginal uptick in Treasury yields, which exerted downward pressure on the broader digital asset complex. As investors recalibrated their expectations for the Federal Reserve’s policy trajectory heading into the second half of the year, a shift toward a more cautious risk-off sentiment led to a reduction in exposure across major altcoins. This macro-driven repricing coincided with a period of thinner seasonal liquidity, amplifying the impact of standard capital outflows from non-Bitcoin assets as market participants favored cash or high-yield traditional instruments.
Within the XRP ecosystem, the lack of immediate catalysts regarding further institutional integration of the XRP Ledger for cross-border settlements has contributed to a temporary cooling of sentiment. While long-term adoption narratives remain focused on the utilization of the asset in institutional liquidity hubs, the absence of fresh developments regarding spot ETF progress in major jurisdictions has led some market participants to rotate capital into sectors with more immediate volatility triggers. On-chain data indicates a slight slowdown in large-scale transactions, suggesting a wait-and-see approach among institutional holders as they monitor the global regulatory environment for stablecoins and digital payments.
From a market structure perspective, the intraday volatility was exacerbated by a cluster of long liquidations in the derivatives market. As XRP tested local support levels, the failure to maintain upward momentum triggered automated sell orders, leading to a cascade of localized liquidations that deepened the pullback. This deleveraging process was further influenced by a shift in funding rates, which had made maintaining long positions increasingly expensive, ultimately forcing a tactical retreat toward more defensive price levels.
Looking ahead, institutional investors continue to monitor the interplay between global liquidity conditions and the evolving legislative landscape for digital assets. While the asset has benefited from established legal clarity in recent years, the focus has shifted toward the practical scalability of Ripple’s payment infrastructure and its competition within the burgeoning stablecoin market. Any further appreciation in the US Dollar or hawkish signals from central bank officials remains the primary headwind for near-term price recovery, while institutional inflows into diversified digital asset investment products serve as the critical gauge for structural demand.
Technical Analysis of XRP (XRPUSD)
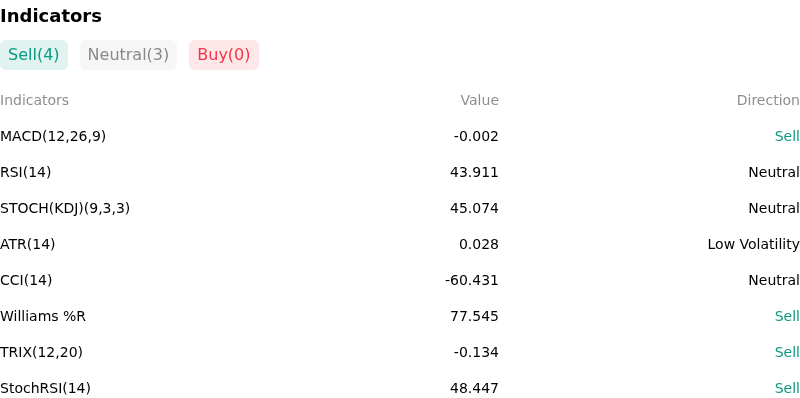
Technically, XRP (XRPUSD) shows a MACD (12,26,9) value of -0.002, indicating a sell signal. The RSI at 43.911 suggests neutral condition and the Williams %R at 77.545 suggests sell condition. Please monitor closely.
More details about XRP (XRPUSD)
Recent Events and Risks:
- Regulatory Litigation Uncertainty: Ripple and the SEC have continued their legal conflict with recent filings regarding the sealing of evidence in the remedies phase; the lack of a final resolution and the potential for a multibillion-dollar penalty continue to suppress institutional demand and create a price ceiling driven by legal risk.
- Concentrated Whale Inflows to Exchanges: On-chain tracking services have identified the movement of over 50 million XRP to centralized exchanges like Bitstamp within the last 48 hours, a behavior typically associated with institutional distribution or preparations for large-scale sell orders, which increases immediate sell-side pressure.
- Negative Capital Rotation: XRP has significantly underperformed major assets like Ethereum and Bitcoin over the past 72 hours, indicating a rotation of liquidity toward assets with immediate ETF-related tailwinds; this lack of capital inflow leaves XRP vulnerable to sharp declines if broader market sentiment shifts to risk-off.
- Derivative Market Liquidation Risk: High open interest in XRP perpetual futures at the $0.52 to $0.53 range has created a "long-heavy" market structure; a breach of current technical support levels risks triggering a liquidation cascade, which could accelerate intraday volatility and cause a rapid drawdown due to a lack of deep buy-side liquidity.
Recommended Articles


