


XRP (XRPUSD) Is down 1.03% on Aug 4: What Do On-Chain Data and Market Sentiment Show?
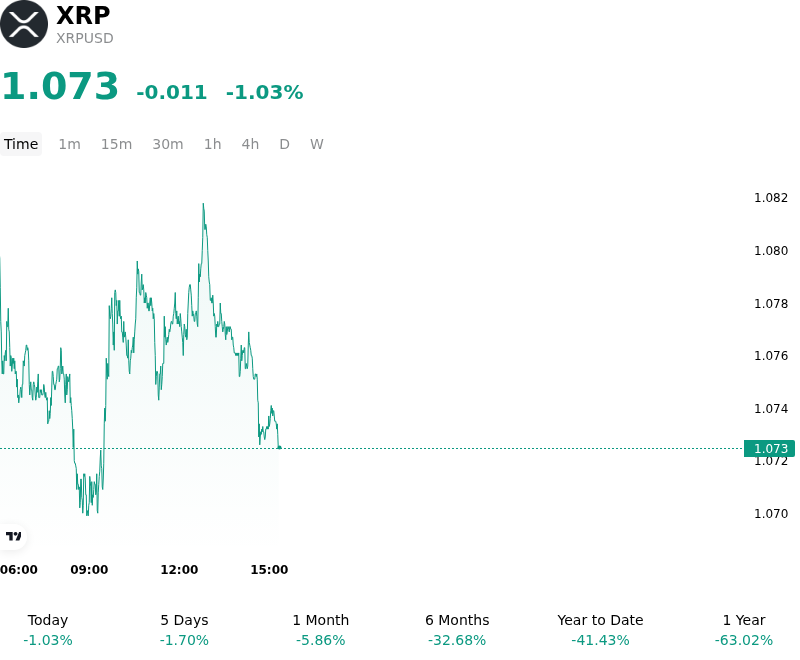
XRP (XRPUSD) is down 1.03% at Aug 4 03:20(ET), now at $1.0725, with a 7-day up of 0.85%.
What is driving XRP (XRPUSD)’s stock price down today?
XRP experienced a period of intraday consolidation as investors recalibrated their exposure in response to a firming US Dollar and a lack of immediate regulatory catalysts. The broader digital asset market faced headwinds from rising US Treasury yields, which increased the opportunity cost of holding non-yielding assets. For XRP specifically, the absence of fresh updates regarding the integration of its institutional payment solutions or new stablecoin deployments on the XRP Ledger led to a lull in buy-side momentum, prompting short-term traders to realize profits.
Institutional sentiment remains sensitive to the evolving landscape of spot XRP ETF applications. Any perceived delay in the approval process or lack of transparency from regulatory bodies regarding the classification of secondary market transactions tends to dampen capital inflows. On this trading session, the absence of significant net inflows into digital asset investment products suggested a cautious approach among institutional desk traders, who are increasingly focusing on the fundamental utility of cross-border payment rails rather than speculative volatility.
From a technical and liquidity perspective, the movement was influenced by a buildup of long positions in the derivatives market. As the price encountered resistance at key psychological levels, a minor wave of liquidations occurred, creating downward pressure on the spot price. This deleveraging event indicates that while long-term conviction remains stable, the market is susceptible to volatility when liquidity conditions tighten or when macroeconomic signals suggest a more restrictive path for global monetary policy.
On-chain metrics indicated a slight increase in exchange inflows, suggesting that some large-scale holders may be hedging their positions against broader macroeconomic uncertainty. Despite the intraday retracement, the structural narrative for XRP continues to center on its role in facilitating institutional liquidity and the maturation of the XRP Ledger. Investors are closely monitoring global regulatory developments and the potential for increased corporate adoption of distributed ledger technology for treasury management, which remain the primary drivers for future valuation.
Technical Analysis of XRP (XRPUSD)
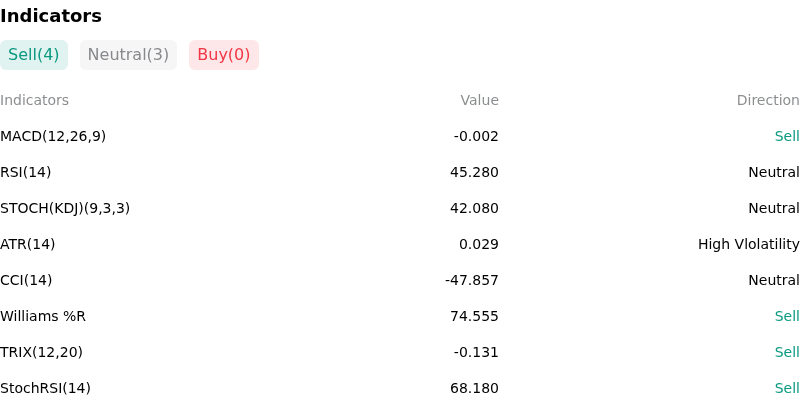
Technically, XRP (XRPUSD) shows a MACD (12,26,9) value of -0.002, indicating a sell signal. The RSI at 45.280 suggests neutral condition and the Williams %R at 74.555 suggests sell condition. Please monitor closely.
More details about XRP (XRPUSD)
Recent Events and Risks:
- Regulatory Litigation Overhang: The ongoing legal battle between Ripple and the SEC continues to present significant downside risk as the market awaits a final judgment on the remedies phase; the wide gap between the SEC’s multi-billion dollar penalty demand and Ripple’s significantly lower counter-offer creates a high-stakes environment where any judicial leaning toward the regulator could trigger a sharp sell-off.
- Whale-Led Exchange Inflows: Recent on-chain tracking has identified the movement of tens of millions of XRP from private wallets to major exchanges like Bitstamp and Bitso over the last 48 hours, signaling increased sell-side liquidity and the potential for large-scale distribution that could overwhelm current buy-side demand.
- Market Capital Rotation: XRP has recently exhibited relative weakness compared to the broader crypto market, specifically failing to capture the momentum seen in other major altcoins following positive regulatory shifts; this underperformance risks further price depreciation as traders rotate capital into assets with stronger near-term catalysts and higher institutional interest.
- Derivatives Liquidation Sensitivity: A concentration of long positions in the perpetual futures market combined with stagnant price action has created a precarious market structure; a failure to maintain psychological support levels near $0.50 could trigger a liquidation cascade, leading to rapid intraday volatility and downside price gapping.
Recommended Articles


