


BlackRock Inc Stock (BLK) Closed Up by 3.44% on Aug 3: Key Drivers Unveiled
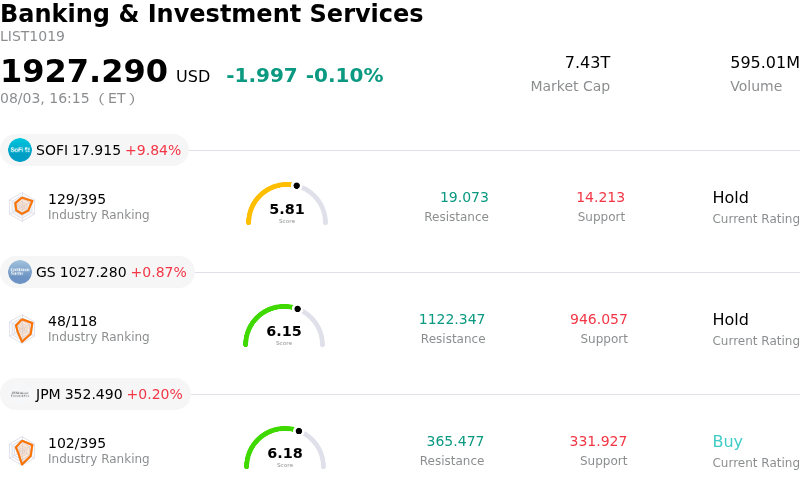
BlackRock Inc (BLK) closed up by 3.44%. The Banking & Investment Services sector is down by 0.10%. The company outperformed the industry. Top 3 stocks by turnover in the sector: SoFi Technologies Inc (SOFI) up 9.84%; Goldman Sachs Group Inc (GS) up 0.87%; JPMorgan Chase & Co (JPM) up 0.20%.
What is driving BlackRock Inc (BLK)’s stock price up today?
The upward momentum in BlackRock shares during today's session reflects a convergence of favorable macroeconomic tailwinds and a strengthening outlook for the firm's private markets segment. Investor sentiment has been bolstered by recent labor market data and cooling inflation figures, which have intensified expectations for a more accommodative monetary policy stance from the Federal Reserve. As the world's largest asset manager, BlackRock is uniquely positioned to benefit from a lower-rate environment, which typically drives up the valuation of its assets under management and stimulates higher client allocations toward risk-on strategies.
Further supporting the positive price action is the recent acceleration of capital inflows into the iShares suite of exchange-traded funds. Institutional demand for both core passive products and specialized thematic vehicles remains robust, reinforcing BlackRock’s dominant market share. Analysts have recently highlighted the firm’s successful integration of recent acquisitions aimed at expanding its footprint in infrastructure and private credit. These high-margin segments provide a structural growth engine that helps insulate the company from the fee compression seen in traditional active management, a factor that is increasingly reflected in the current valuation premium.
Market participants are also responding to positive updates regarding the firm’s technology platform, Aladdin. The continued expansion of its software-as-a-service offerings provides a steady stream of recurring revenue that enhances the company's financial resilience. Combined with a disciplined approach to capital return, including consistent dividend growth and share repurchases, the fundamental outlook remains attractive to long-term institutional investors. The intraday volatility observed appears to be driven by large-scale portfolio rebalancing as funds rotate back into financial services leaders following a period of defensive positioning.
From a risk perspective, while geopolitical tensions and currency fluctuations remain persistent headwinds for global asset managers, BlackRock’s diversified geographic presence and product mix mitigate localized shocks. The current trajectory suggests that the market is placing greater emphasis on the firm’s ability to capture the massive transition of wealth into private markets and digital assets. As long as the broader market maintains its appetite for risk and the interest rate path remains predictable, the structural advantages of the BlackRock platform are expected to sustain its leadership position in the global investment landscape.
Technical Analysis of BlackRock Inc (BLK)
Technically, BlackRock Inc (BLK) shows a MACD (12,26,9) value of 9.744, indicating a buy signal. The RSI at 58.931 suggests neutral condition and the Williams %R at 33.948 suggests buy condition. Please monitor closely.
Media Coverage of BlackRock Inc (BLK)
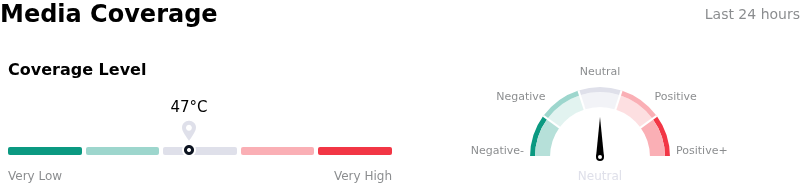
In terms of media coverage, BlackRock Inc (BLK) shows a coverage score of 47, indicating a moderate level of media attention. The overall market sentiment index is currently in neutral zone.
Fundamental Analysis of BlackRock Inc (BLK)
BlackRock Inc (BLK) is in the Banking & Investment Services industry. Its latest annual revenue is $20.39B, ranking 12 in the industry. The net profit is $5.55B, ranking 6 in the industry. Company Profile
Over the past month, multiple analysts have rated the company as Buy, with an average price target of $1293.34, a high of $1488.00, and a low of $1059.00.
More details about BlackRock Inc (BLK)
Company Specific Risks:
- Net Inflow Underperformance: BlackRock recently reported quarterly net inflows that fell substantially short of institutional analyst expectations, raising concerns about a deceleration in client demand despite the firm reaching record levels of total assets under management.
- Passive Fee Compression: Continued structural shifts toward low-cost passive investment vehicles are weighing on average realized fee rates, creating a potential mismatch between asset growth and revenue expansion as high-margin active management products see relative outflows.
- Regulatory and Political Headwinds: The firm continues to face concentrated pressure from U.S. state regulators and treasuries regarding its investment stances, leading to targeted divestments and increased operational costs to manage diverging regional compliance and reporting standards.
- Integration and Valuation Risk: The large-scale acquisition of Global Infrastructure Partners (GIP) carries significant execution risk, with the high purchase price and complex integration process potentially impacting short-term capital flexibility and earnings per share consistency.
Recommended Articles


