


Solana (SOLUSD) Suddenly Goes down 1.08% on Aug 1: What's Driving This
Solana (SOLUSD) is down 1.08% at Aug 1 13:30(ET), now at $71.17, with a 7-day down of 3.10%.
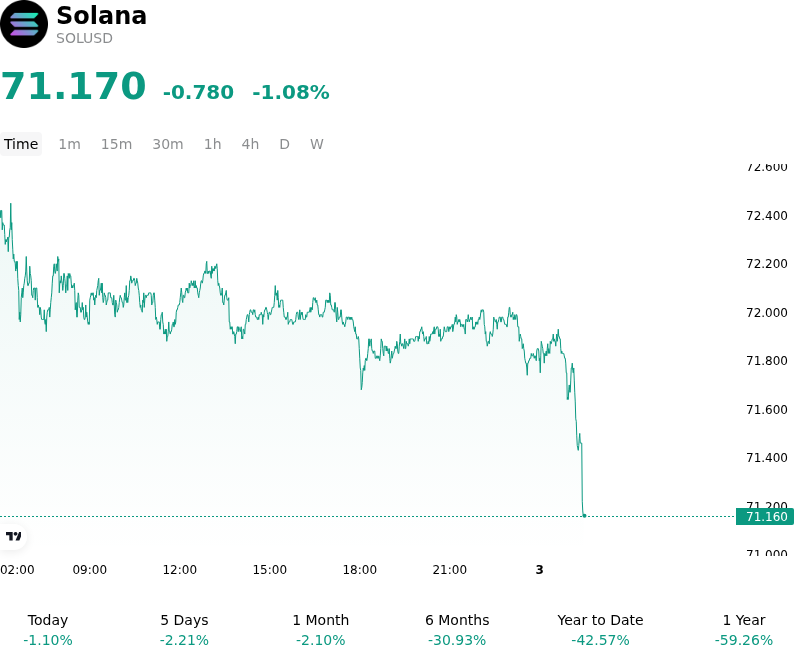
What is driving Solana (SOLUSD)’s stock price down today?
The recent downward pressure on Solana is primarily a reflection of shifting macro sentiment following US economic data that has bolstered the higher-for-longer interest rate narrative. As Treasury yields remain elevated, the opportunity cost of holding non-yielding digital assets increases, prompting a rotation out of high-beta risk assets. This broader market de-risking is being felt acutely in the Solana ecosystem, which typically exhibits higher sensitivity to global liquidity shifts compared to Bitcoin or Ethereum.
Institutional appetite for Solana is currently being tested by a slowdown in ecosystem-specific capital inflows. While expectations for a spot Solana ETF remain a primary long-term narrative, the lack of immediate regulatory progress or a lull in institutional derivative buying has led to a cooling of speculative fervor. Large-scale holders appear to be trimming positions to manage risk at the start of the new month, especially as the market grapples with a lack of fresh catalysts to push the price through established resistance levels.
On-chain activity shows a moderate contraction in decentralized exchange volumes and a plateauing of active addresses, suggesting a temporary exhaustion in the retail-driven activity that has historically fueled Solana's network demand. Furthermore, intensified competition from emerging modular scaling solutions is forcing a tactical repricing of Solana’s premium as a high-throughput monolithic chain. This competitive pressure, combined with the absence of significant protocol upgrades in the immediate window, has contributed to a more cautious stance among mid-term allocators.
From a positioning standpoint, the decline was exacerbated by a wave of long liquidations in the perpetual swaps market. With liquidity naturally thinning over the weekend, these forced exits created downward pressure that outpaced organic buying interest. Market participants are now focused on whether the current support levels will hold or if a further structural shift in global liquidity will necessitate a deeper revaluation of the Solana ecosystem’s growth trajectory relative to its Layer-1 peers.
Technical Analysis of Solana (SOLUSD)
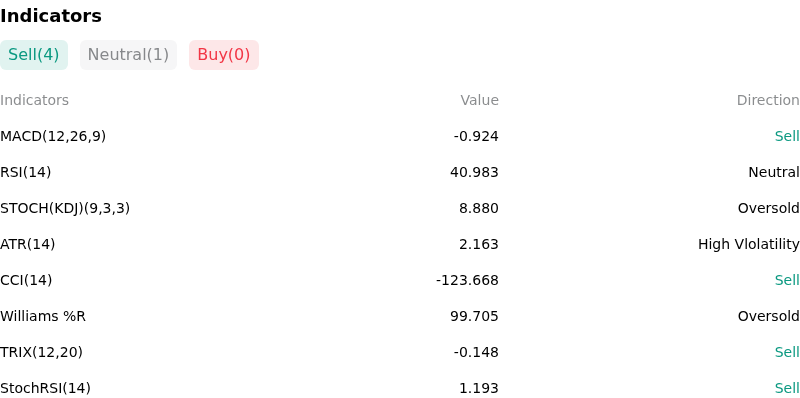
Technically, Solana (SOLUSD) shows a MACD (12,26,9) value of -0.924, indicating a sell signal. The RSI at 40.983 suggests neutral condition and the Williams %R at 99.705 suggests oversold condition. Please monitor closely.
More details about Solana (SOLUSD)
Recent Events and Risks:
- Regulatory Barriers to Spot ETF Approval: Despite recent optimism surrounding Ethereum ETFs, institutional analysts have highlighted that Solana lacks a CME-regulated futures market, which remains a primary requirement for the SEC to approve a Spot SOL ETF, leading to potential capital rotation out of SOL and into approved assets.
- FTX Estate Liquidation Overhang: The ongoing scheduled auctions and distributions of the FTX estate's significant SOL holdings continue to create a supply overhang; institutional buyers of these discounted tranches frequently utilize the spot market to hedge their lock-up periods, suppressing price momentum.
- Network Economic Policy Shifts: Recent governance discussions regarding the distribution of 100% of priority fees to validators have sparked concerns over the reversal of previous deflationary "fee-burn" mechanisms, potentially increasing the circulating supply and diluting long-term holder value.
- Concentrated Leverage and Liquidation Risk: Market structure data shows a high density of leveraged long positions clustered just below current price levels; a breach of these support zones could trigger a liquidation cascade, which may be exacerbated by potential network latency during high-volatility events.
Recommended Articles


