


BNB (BNBUSD) Fluctuated Significantly on Aug 1: Key Variables Behind the Move
BNB (BNBUSD) is down 1.04% at Aug 1 07:00(ET), now at $578.8, with a 7-day up of 2.19%.
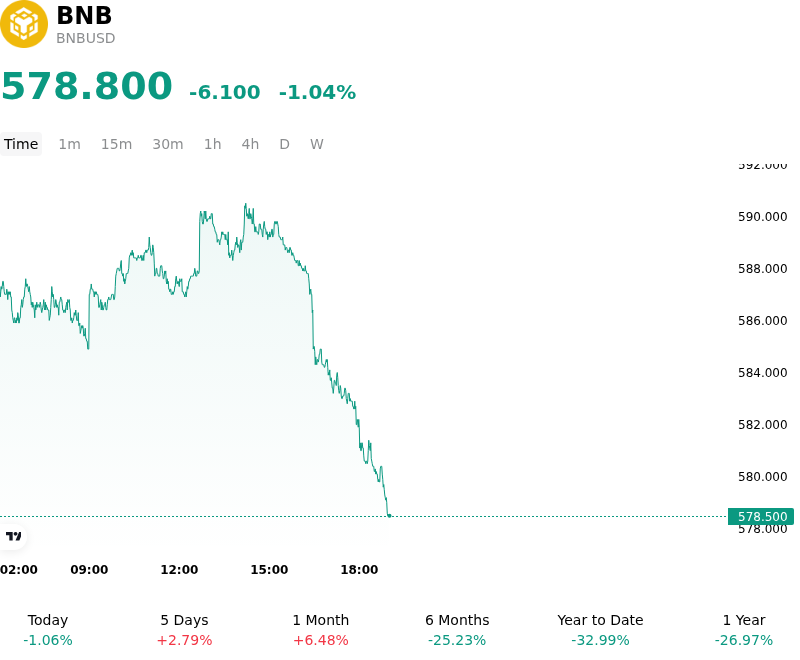
What is driving BNB (BNBUSD)’s stock price down today?
The decline in BNB reflects a broader tactical rebalancing among institutional participants as global macro liquidity conditions face renewed pressure. With the U.S. Dollar showing localized strength and Treasury yields remaining at levels that challenge the risk-premium for digital assets, capital flows have shifted toward more conservative allocations. For BNB, this environment is compounded by its unique position as both a utility token for the world’s largest exchange and the foundational asset for a major smart-contract ecosystem. The current downward pressure suggests a reduction in speculative positioning as investors weigh the impact of higher-for-longer interest rate expectations on retail trading volumes and platform-specific activity.
Regulatory considerations continue to serve as a primary headwind for institutional adoption and long-term sentiment. While the ecosystem has matured significantly, the persistent focus from global financial watchdogs on centralized exchange operations maintains a baseline of risk that institutional desks must account for in their capital models. The price movement indicates a cautious stance from large-scale holders who are sensitive to shifts in the compliance landscape, particularly regarding the cross-border movement of capital and the treatment of platform-native assets. This regulatory overhang tends to limit the upside during periods of macro uncertainty, as investors prioritize assets with clearer legal standing or those supported by regulated spot ETF structures.
On-chain dynamics and ecosystem competition also contribute to the current sentiment. Data from the BNB Chain suggests a stabilization, rather than growth, in decentralized finance activity, as capital increasingly migrates toward emerging Layer-2 solutions and high-throughput Layer-1 competitors. The relative stagnation in total value locked and a decrease in unique active wallets over the recent sessions indicate that the immediate demand for BNB as a gas token or collateral asset has softened. Furthermore, the absence of high-impact token launches or incentive programs, which typically drive demand for BNB for participation in primary offerings, has left a void in the immediate capital inflow pipeline.
From a derivatives perspective, the move lower has been exacerbated by a moderate flush-out of long positions. Over the preceding days, funding rates had tilted positive, suggesting a buildup of leveraged retail sentiment that became vulnerable to a macro-driven pullback. As price action breached technical support levels, a cascade of automated liquidations and stop-loss triggers accelerated the decline, despite the underlying deflationary pressure provided by the protocol's burn mechanism. Moving forward, the market remains focused on the interplay between exchange-driven utility and the broader institutional shift toward assets that exhibit lower sensitivity to centralized platform risks.
Technical Analysis of BNB (BNBUSD)
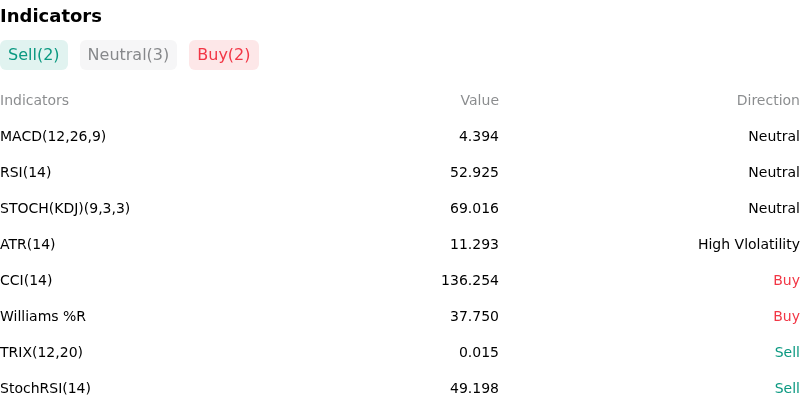
Technically, BNB (BNBUSD) shows a MACD (12,26,9) value of 4.394, indicating a neutral signal. The RSI at 52.925 suggests neutral condition and the Williams %R at 37.750 suggests buy condition. Please monitor closely.
More details about BNB (BNBUSD)
Recent Events and Risks:
- Regulatory and Enforcement Overhang: The ongoing legal battle between the SEC and Binance concerning the classification of BNB as an unregistered security remains a critical downside catalyst, as adverse court rulings or new enforcement actions could lead to delistings or restricted liquidity for U.S.-based market participants.
- Market Structure and Liquidation Clusters: Recent derivatives data indicates a significant buildup of leveraged long positions; a failure to maintain current support levels risks triggering a liquidation cascade, potentially resulting in rapid intraday price depreciation as automated stop-loss orders are executed.
- On-Chain Whale Movement: Blockchain telemetry has identified large-scale transfers of BNB from long-term dormant wallets to exchange deposit addresses within the last 48 hours, suggesting a shift toward profit-taking that could increase immediate sell-side pressure and overwhelm existing buy walls.
- Ecosystem Utility and Staking Fatigue: A recent slowdown in high-tier project launches on the Binance Launchpool has reduced the immediate demand for BNB as a staking asset, creating a risk that holders who primarily utilize the token for yield generation may begin to liquidate their positions in favor of more active ecosystems.
Recommended Articles


