


EUR/USD (EURUSD) Is down 0.58% on Jul 31: What Is Behind the Currency Move?
EUR/USD (EURUSD) is down 0.58% at Jul 31 09:40(ET), now at $1.14596, with a 7-day up of 0.81%.
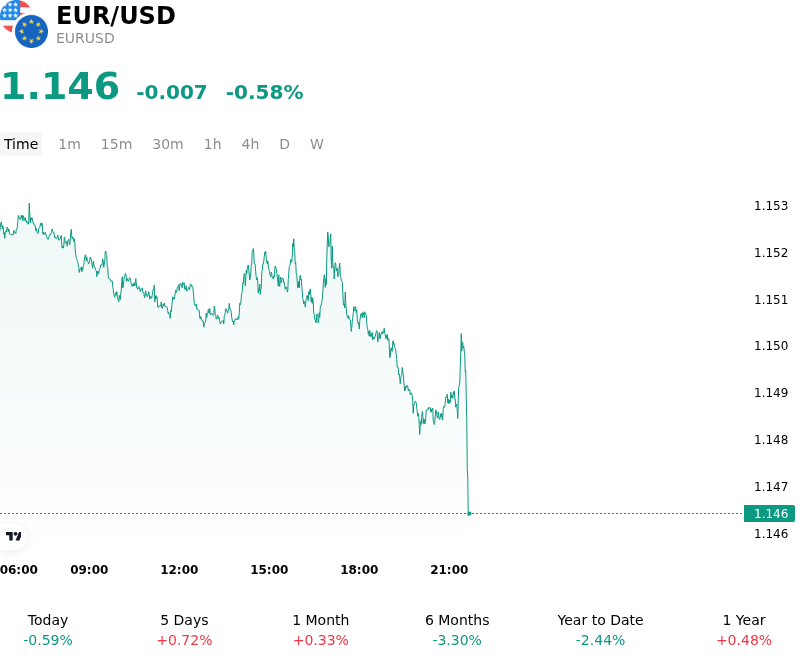
What is driving EUR/USD (EURUSD)’s stock price down today?
The downward pressure on EURUSD is primarily a result of widening interest-rate differentials as market participants adjust their expectations for the Federal Reserve and the European Central Bank. Stronger-than-anticipated US macroeconomic data, specifically related to the labor market and core inflation, has reinforced a higher-for-longer interest rate narrative in the United States. This has led to a significant repricing of the Fed's terminal rate, pushing short-dated US Treasury yields higher and increasing the carry advantage of the dollar over the euro.
Conversely, the Eurozone continues to face a more fragile growth outlook. Recent data releases indicating a faster-than-expected decline in headline inflation across major member states have provided the European Central Bank with the necessary room to maintain a more accommodative or less restrictive policy stance. The resulting divergence in monetary policy trajectories has prompted institutional investors to rotate capital out of euro-denominated assets in favor of the higher-yielding dollar, weighing heavily on the currency pair.
Technical factors and month-end institutional flows have also contributed to the intraday weakness. As July comes to a close, global asset managers frequently rebalance portfolios to account for monthly performance shifts in equity and bond markets. Given the relative outperformance of US markets during the period, these rebalancing flows often involve the selling of the euro against the dollar to satisfy hedging requirements. This mechanical selling pressure, combined with the breach of key technical support levels, has accelerated the downward move.
Risk sentiment remains a critical secondary driver. While broader markets have shown resilience, any localized geopolitical tensions or uncertainty regarding future fiscal policy in the Eurozone can trigger a flight-to-safety move toward the dollar. As investors prioritize liquidity and yield, the dollar’s role as the primary reserve currency provides it with a structural advantage in a high-interest-rate environment, especially when compared to a euro that is sensitive to regional energy costs and stagnant industrial production.
Looking ahead, the sustainability of this move will depend on whether upcoming US employment reports confirm the current resilience of the economy. If the US data remains robust while Eurozone activity continues to lag, the euro remains vulnerable to further depreciation as the yield spread between the 10-year Treasury and the 10-year Bund remains wide. Investors will likely remain cautious, focusing on the potential for further hawkish surprises from the Fed during its next policy communication.
Technical Analysis of EUR/USD (EURUSD)
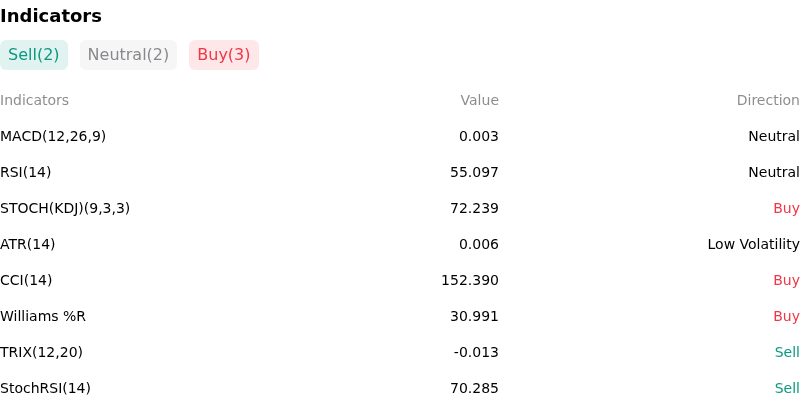
Technically, EUR/USD (EURUSD) shows a MACD (12,26,9) value of 0.003, indicating a neutral signal. The RSI at 55.097 suggests neutral condition and the Williams %R at 30.991 suggests buy condition. Please monitor closely.
More details about EUR/USD (EURUSD)
Recent Events and Risks:
- Fed 'Higher for Longer' Rhetoric: Recent commentary from Federal Reserve Governor Christopher Waller indicating a need for several more months of favorable inflation data before considering rate cuts has bolstered the US Dollar and increased downside pressure on EUR/USD.
- Divergent Monetary Policy Expectations: Market anticipation of an ECB rate cut in June, contrasted with the Fed's cautious stance as highlighted by today's upcoming FOMC minutes, threatens to widen the US-German yield spread and trigger Euro depreciation.
- Anticipated Flash PMI Weakness: Concerns surrounding tomorrow's release of Eurozone and German Flash PMI data, where any signs of persistent manufacturing contraction could undermine the recent recovery narrative and dampen investor sentiment.
- Safe-Haven Capital Flows: Renewed volatility in global equity markets following hawkish central bank signals and geopolitical uncertainty in the Middle East continues to drive liquidity toward the US Dollar at the expense of risk-sensitive pairs.
Recommended Articles


