


Brent (UKOIL) Drops on Jul 31: What Lie behind the Move?
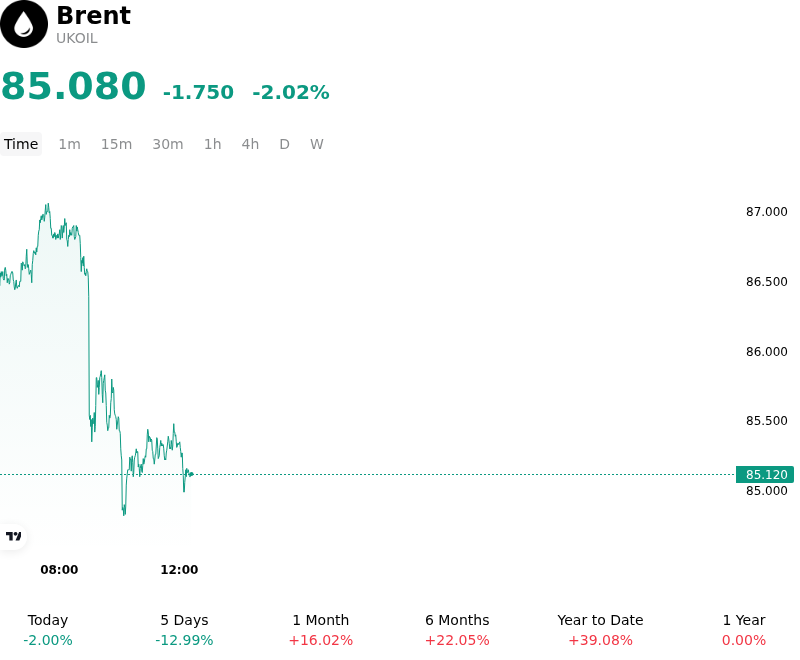
Brent (UKOIL) is down 2.02% at Jul 31 00:25(ET), now at $85.08, with a 7-day down of 8.13%.
What is driving Brent (UKOIL)’s stock price down today?
The downward pressure on Brent crude is primarily driven by underwhelming manufacturing data from China, which has intensified concerns regarding a structural slowdown in the world's largest oil importer. The release of the July manufacturing Purchasing Managers Index indicated a deeper-than-expected contraction in industrial activity, suggesting that domestic stimulus measures have yet to catalyze a meaningful recovery in energy-intensive sectors. This demand-side fragility is weighing heavily on the global consumption outlook for the remainder of the year, leading institutional investors to revise their second-half balance projections downward.
On the supply side, market sentiment has been dampened by signals that OPEC+ may proceed with its planned phase-out of voluntary production cuts despite the softening demand environment. The prospect of returning barrels to the market, coupled with sustained production growth from non-OPEC producers in the Americas, has shifted the narrative from a potential supply deficit to a possible surplus. This perceived shift in the alliance's strategy toward defending market share rather than maintaining a strict price floor has triggered a reassessment of risk premiums across the forward curve.
Further compounding the decline is the recent strength of the US Dollar, which has made dollar-denominated commodities more expensive for international buyers. A hawkish lean in recent central bank communications has bolstered the greenback, creating a persistent headwind for the energy complex. Additionally, high-frequency inventory data from the United States indicated a surprising build in refined product stocks, suggesting that the peak summer driving season is delivering less demand than seasonal norms would typically dictate.
From a technical perspective, the breach of key psychological support levels has accelerated systematic selling. The combination of deteriorating fundamentals and the liquidation of long positions by managed money funds has increased intraday volatility. Investors remain focused on whether the current weakness reflects a temporary mid-year lull or a broader structural shift toward a well-supplied market entering 2027. Geopolitical risk premiums also continue to erode as supply routes remain largely unaffected despite ongoing regional tensions, removing a previous pillar of price support.
Technical Analysis of Brent (UKOIL)
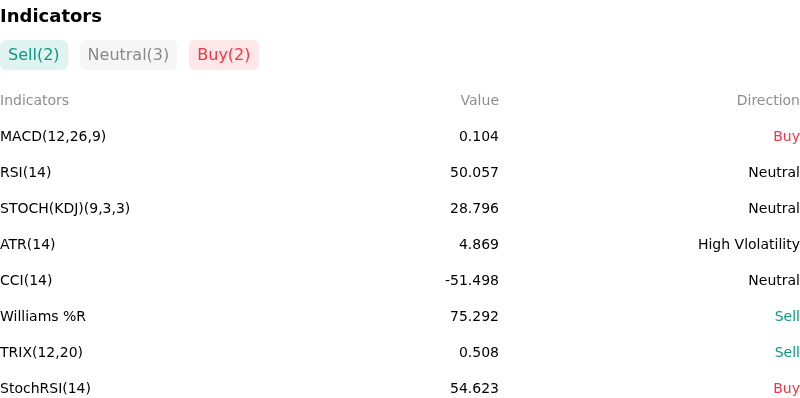
Technically, Brent (UKOIL) shows a MACD (12,26,9) value of 0.104, indicating a buy signal. The RSI at 50.057 suggests neutral condition and the Williams %R at 75.292 suggests sell condition. Please monitor closely.
More details about Brent (UKOIL)
Recent Events and Risks:
- OPEC+ Supply Normalization: Market participants are increasingly concerned by recent signals that OPEC+ remains committed to phasing out voluntary production cuts starting in December, potentially resulting in a significant supply surplus during a period of slowing global consumption.
- Chinese Industrial Demand Weakness: Disappointing economic data and reports of reduced refinery run rates in China over the last 48 hours have intensified fears that the world’s largest importer is facing structural demand deterioration, removing a critical pillar of support for Brent prices.
- Refined Product Inventory Builds: Recent inventory data indicating unexpected builds in gasoline and distillate stocks suggests a cooling of end-user demand, which threatens to squeeze refinery margins and reduce the immediate physical demand for crude oil.
- Geopolitical Risk Premium Erosion: As immediate concerns regarding a direct escalation targeting regional energy infrastructure in the Middle East have failed to materialize in the last 72 hours, the rapid unwinding of geopolitical hedges is driving intraday volatility and downward price corrections.
Recommended Articles


