


Ethereum (ETHUSD) Is down 1.05% on Jul 31: What Do On-Chain Data and Market Sentiment Show?
Ethereum (ETHUSD) is down 1.05% at Jul 31 01:45(ET), now at $1899.09, with a 7-day up of 2.19%.
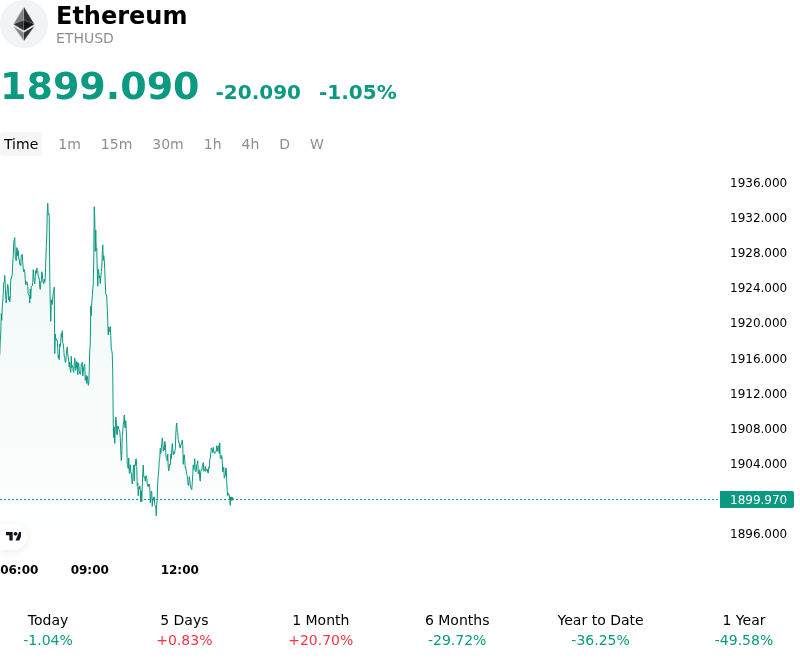
What is driving Ethereum (ETHUSD)’s stock price down today?
The decline in Ethereum appears driven by a combination of end-of-month institutional rebalancing and a recalibration of global liquidity expectations following recent central bank communications. As July concludes, systematic funds and institutional portfolios are adjusting their digital asset weights, often leading to localized liquidity drains in higher-beta assets like Ether. The persistent strength in U.S. Treasury yields has further tightened financial conditions, diminishing the relative attractiveness of non-yielding assets and prompting a rotation out of risk-sensitive crypto holdings.
Spot Ethereum ETF activity has shown signs of exhaustion after a period of sustained accumulation earlier in the quarter. Intraday volatility suggests that institutional participation via these regulated vehicles has shifted toward capital preservation rather than aggressive expansion. Preliminary data indicates a slowdown in net inflows into major U.S.-based spot ETH products, suggesting that professional investors are de-risking ahead of the weekend. This cooling of institutional demand has left the market susceptible to downside pressure as liquidity depth remains sensitive to large-scale sell orders on centralized exchanges.
On-chain metrics reveal a notable increase in exchange inflows from large-scale holders, indicating a tactical move to hedge against further downside or realize profits from the preceding weeks. In the derivatives market, the funding rate for Ether perpetual futures has compressed, reflecting a reduction in long-side leverage as traders become increasingly cautious. The liquidation of overleveraged long positions during the intraday dip likely accelerated the downward move, clearing out speculative excess that had accumulated during the mid-month rally.
While the broader Ethereum ecosystem continues to see robust development in Layer-2 scaling solutions, market sentiment is currently being tested by competitive pressures from alternative Layer-1 networks. Investors are closely monitoring network fee generation and the overall deflationary mechanics of the protocol, which have moderated in recent sessions. Despite the current price weakness, the structural narrative of Ethereum as an institutional-grade asset remains intact. However, investors continue to monitor regulatory risks, specifically regarding the classification of staking-as-a-service providers, which could influence long-term yield expectations and institutional capital commitment.
Technical Analysis of Ethereum (ETHUSD)
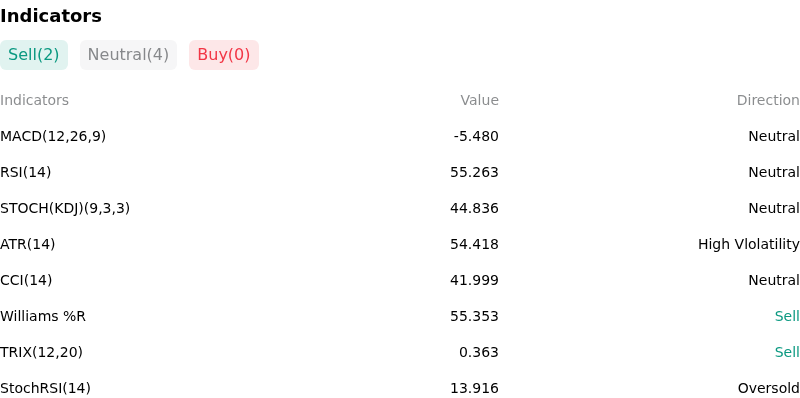
Technically, Ethereum (ETHUSD) shows a MACD (12,26,9) value of -5.480, indicating a neutral signal. The RSI at 55.263 suggests neutral condition and the Williams %R at 55.353 suggests sell condition. Please monitor closely.
More details about Ethereum (ETHUSD)
Recent Events and Risks:
- Institutional Outflow Pressure: Recent data indicates a significant reversal in spot Ethereum ETF flows, with multiple days of net outflows totaling hundreds of millions, suggesting that institutional investors are de-risking and removing a primary source of buy-side liquidity.
- On-Chain Sell-Side Concentration: Blockchain tracking has identified substantial ETH transfers from the Ethereum Foundation and several prominent whale wallets to centralized exchanges like Kraken and Coinbase within the last 48 hours, raising the probability of immediate market absorption issues and price suppression.
- Staking Regulatory Uncertainty: Renewed regulatory focus on "staking-as-a-service" and the classification of liquid staking tokens (LSTs) has created a localized risk event, as market participants fear potential enforcement actions could lead to mass unstaking and secondary market volatility.
- Leverage Unwind Vulnerability: High open interest in ETH futures combined with a recent uptick in funding rates indicates a market leaning heavily long; any sudden downward price movement below key technical support levels risks triggering a liquidation cascade, exacerbating intraday volatility.
Recommended Articles


