


Wheat Futures (WHEAT-F) Is up 2.23% on Jul 30: Why It Happened
Wheat Futures (WHEAT-F) is up 2.23% at Jul 30 02:40(ET), now at $674.46, with a 7-day down of 2.95%.
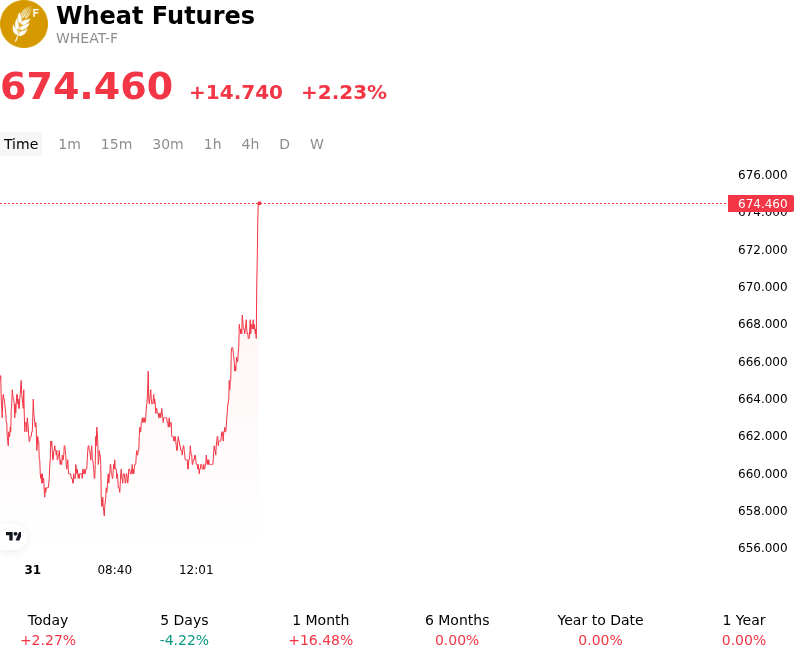
What is driving Wheat Futures (WHEAT-F)’s stock price up today?
The advance in wheat futures is primarily driven by deteriorating crop conditions across the Northern Hemisphere spring wheat belt. Intense heatwaves and persistent moisture deficits in the U.S. Northern Plains and Canadian Prairies have led to a downward revision in yield expectations. As the market enters a critical late-stage development period for spring varieties, institutional investors are pricing in a tighter global supply of high-protein wheat, which is essential for global blending requirements.
Simultaneously, harvest operations for winter wheat in Western Europe, particularly in France and Germany, are facing significant headwinds from unseasonal and heavy rainfall. These conditions are not only delaying the harvest but also raising acute concerns regarding grain quality and falling numbers, potentially relegating a larger portion of the European crop to animal feed rather than human consumption. This divergence between quantity and milling quality is tightening the balance sheet for premium grades, forcing millers to seek alternative supplies.
Geopolitical tensions in the Black Sea region continue to provide a substantial risk premium to the market. Recent reports of renewed disruptions to shipping routes and logistical bottlenecks at major export hubs have heightened fears of supply chain fragility. Given that the region remains a pivotal source of low-cost wheat for global markets, any perceived threat to the stability of export flows prompts immediate short-covering and speculative buying from funds seeking to hedge against a broader disruption.
On the macroeconomic front, a weakening U.S. dollar has provided additional tailwinds, making U.S. exports more competitive on the global stage. This currency move coincided with a flurry of buy-side activity in the physical market, as major state importers issued new tenders to secure coverage amidst the rising price environment. The combination of weather-induced supply constraints and a favorable currency backdrop has shifted the near-term technical outlook, encouraging institutional capital to rotate back into the agricultural sector as a hedge against tightening global balances.
Technical Analysis of Wheat Futures (WHEAT-F)
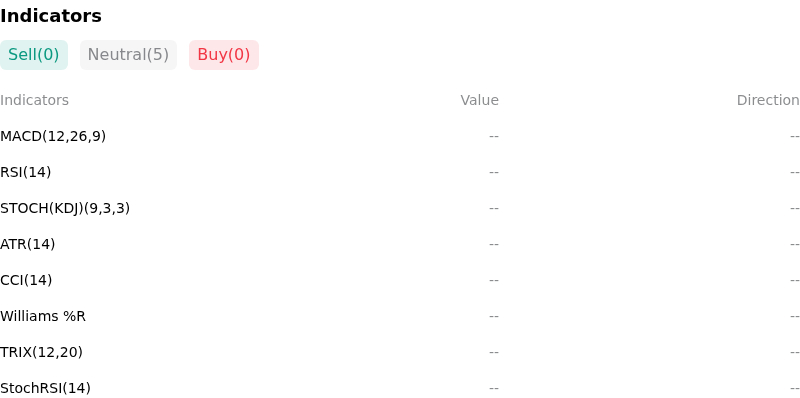
Technically, Wheat Futures (WHEAT-F) shows a MACD (12,26,9) value of 0.000, indicating a neutral signal. The RSI at 59.984 suggests neutral condition and the Williams %R at 47.566 suggests neutral condition. Please monitor closely.
More details about Wheat Futures (WHEAT-F)
Recent Events and Risks:
- Accelerated Harvest Pressure: The rapid pace of the U.S. winter wheat harvest, which is currently trending ahead of historical averages, is increasing immediate physical supply and triggering heavy seasonal hedge selling by commercial elevators.
- Competitive Russian Export Pricing: Despite earlier production concerns, Russian wheat remains aggressively priced in the global market, with recent tender results indicating that Black Sea origins continue to undercut Western European and U.S. prices to capture market share.
- Currency-Driven Export Headwinds: The recent strengthening of the U.S. Dollar Index (DXY) is making U.S.-origin wheat significantly more expensive for international buyers, dampening demand at a time when global supplies are seasonally high.
- Speculative Long Liquidation: Easing weather concerns in parts of Western Europe and Australia over the last 48 hours have led to a sharp reduction in the "weather premium," prompting institutional investors to unwind long positions and exacerbating intraday downward price momentum.
Recommended Articles


