


Gold Price Forecast: Can Gold Hold $4,020 as Fed Rate Hike Expectations Rise?
TradingKey - As of the Asian session on July 30, gold prices ( XAUUSD) surged and then retraced following the Federal Reserve meeting, once falling to $4,028.62 during the session. From a market perspective, after the Fed announced its interest rate decision, gold prices once surged to $4,116.28 but failed to hold above the $4,100 mark. As the market reassessed divisions within the Fed regarding interest rate hikes, U.S. Treasury yields rebounded, and short-term bullish momentum for gold weakened significantly.
Why Gold Prices Fell After Surging as Fed Keeps Rates Unchanged?
The Federal Reserve kept the target range for the federal funds rate unchanged at 3.50% to 3.75% at its July meeting, in line with mainstream market expectations. The decision was approved by a 9-3 vote, with the three dissenters advocating for a 25-basis-point rate hike, indicating a significant rise in concern over inflation risks within the Fed.
Following the rate decision, the US dollar and Treasury yields dipped briefly, pushing spot gold up by about 2% at one point to touch a high of $4,116.28. Because gold is a non-yielding asset, falling Treasury yields reduce the opportunity cost of holding the metal, prompting a rapid flow of capital back into the gold market.
However, Federal Reserve Chairman Kevin Warsh continued to emphasize at the press conference that inflation remains too high, stating that the Fed will not waver in its commitment to achieving the 2% inflation target. Meanwhile, he reduced explicit guidance on the future policy path, meaning whether to raise interest rates in September will depend more on upcoming inflation, employment, and energy price data.
The support from three officials for a rate hike gave this meeting a distinctly hawkish tone. Although the Fed did not raise rates immediately, more committee members now believe that the current interest rates are insufficient to contain inflation. Market bets on a September rate hike remain high, with the latest pricing showing that traders expect a roughly 65% probability of a rate hike in September.
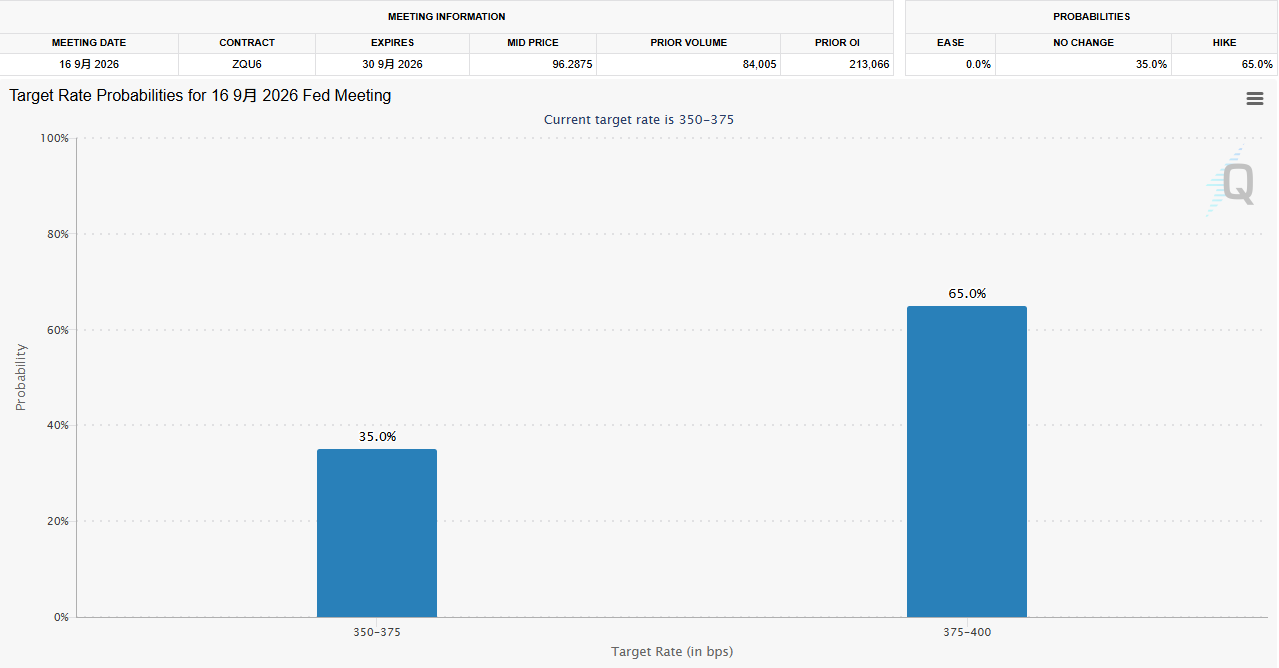
Source: CME Group
This is precisely the main reason why gold prices quickly pulled back after breaking through $4,100. While the Fed's decision to stand pat was a short-term positive for gold, the internal disagreement over rate hikes and Warsh's hawkish stance on inflation suggest that US interest rates may still remain elevated for longer, or even be raised further in September. As the 10-year US Treasury yield climbed back up, gold prices retreated under pressure.
Looking ahead, the market will focus closely on US PCE inflation, non-farm payrolls, and oil price movements. If PCE data shows that inflation continues to cool, the market may scale back expectations for a September rate hike, which could drag down the US dollar and Treasury yields, potentially allowing gold to make another run at $4,100. Conversely, if inflation exceeds expectations or energy prices rebound, market bets on a Fed rate hike could heat up, keeping gold prices under pressure.
Gold Price Technical Analysis: $4,100 Breakout Fails, Short-Term Support at $4,020 in Focus
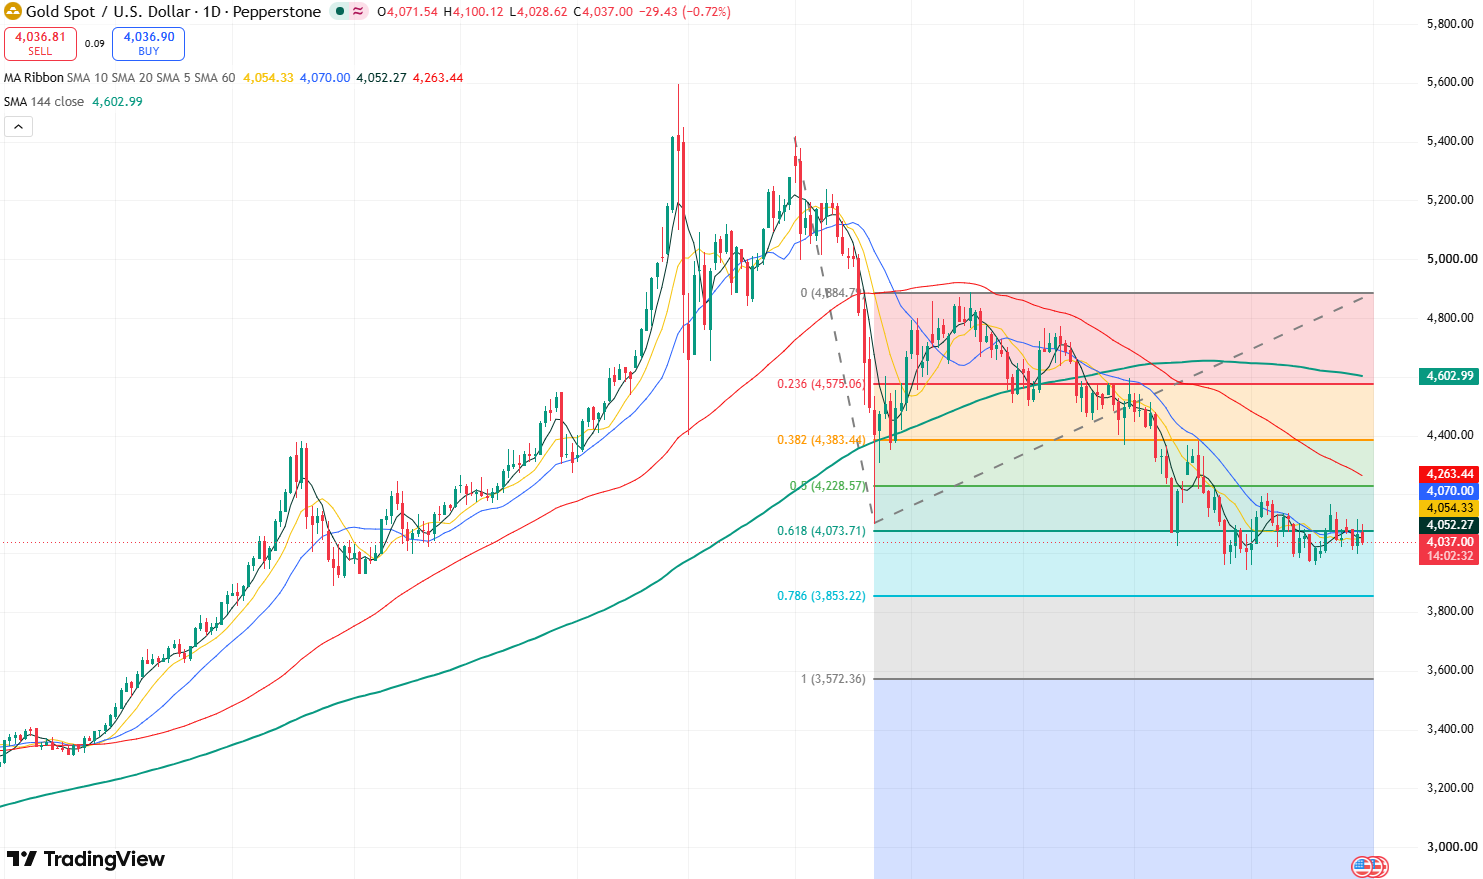
Gold Price Daily Chart, Source: TradingView
Looking at the daily chart of gold, boosted by the positive news of the Federal Reserve keeping interest rates unchanged, gold prices briefly surged above $4,100 on Wednesday. However, the closing price for the day remained below $4,100, indicating a weakening of bullish momentum in the market. In the short term, gold prices are likely to continue consolidating around $4,000.
On the downside, the primary support level to watch for gold is $4,020. If this level is breached, gold prices may continue to fall back, testing the support level at $3,970.
On the upside, if gold prices find a firm floor above $4,020, short-term bullish momentum will be reinforced, paving the way to continue testing the resistance at $4,100. A breakout above this level would open up further upside toward $4,200.
Recommended Articles


