


BNB (BNBUSD) Volatility Intensified on Jul 30: What You Should Know
BNB (BNBUSD) is up 1.03% at Jul 30 02:05(ET), now at $571.3, with a 7-day up of 0.97%.
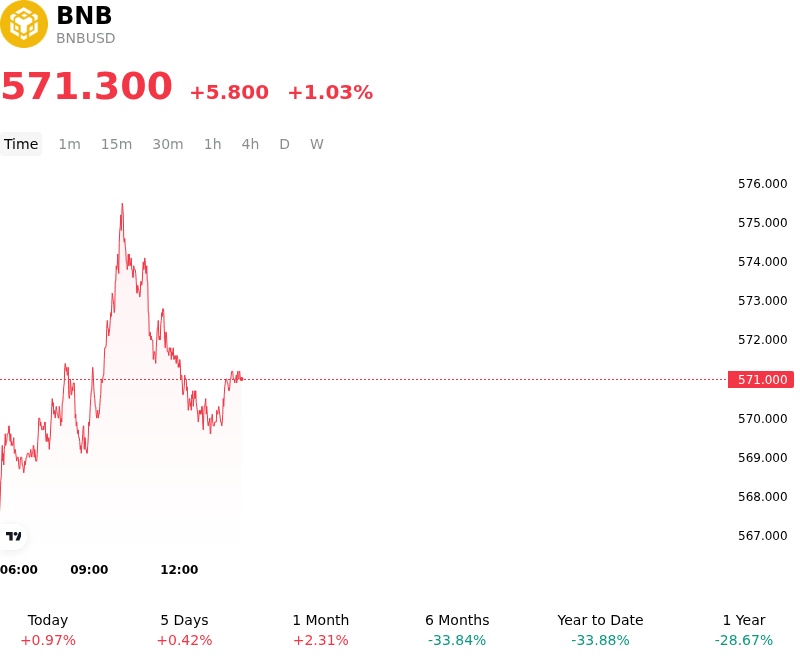
What is driving BNB (BNBUSD)’s stock price up today?
The appreciation of BNB reflects a strengthening of demand-side liquidity within the Binance ecosystem, likely driven by renewed activity in decentralized finance and on-chain protocol participation. Institutional interest has remained resilient as the platform continues to demonstrate a shift toward comprehensive regulatory compliance and transparent operations, which has effectively lowered the risk premium historically associated with the asset.
Intraday volatility was exacerbated by a spike in demand for BNB to participate in ecosystem-wide staking initiatives and new project allocations. This utility-driven buy pressure often leads to a tightening of available exchange supply, forcing short-term speculators to cover positions. Furthermore, the broader macro environment provided a supportive backdrop as stabilizing global liquidity conditions and a softening US dollar encouraged a rotation into high-beta digital assets across the board.
On-chain metrics suggest that the increase in valuation is supported by rising transaction volumes and the successful integration of institutional-grade tokenization projects on the BNB Chain. The migration of capital toward the network's decentralized applications highlights a structural trend where investors prioritize assets with proven utility and deflationary burn mechanisms that offset supply expansion.
Despite the positive price action, professional participants continue to monitor the impact of derivatives positioning. The volatility observed during the session suggests that leveraged long positions and the liquidation of short contracts played a role in the asset's rapid price fluctuations. As the market matures, the correlation between BNB and broader index-weighted assets remains significant, though its idiosyncratic ecosystem drivers are increasingly serving as a primary catalyst for capital inflows.
Technical Analysis of BNB (BNBUSD)
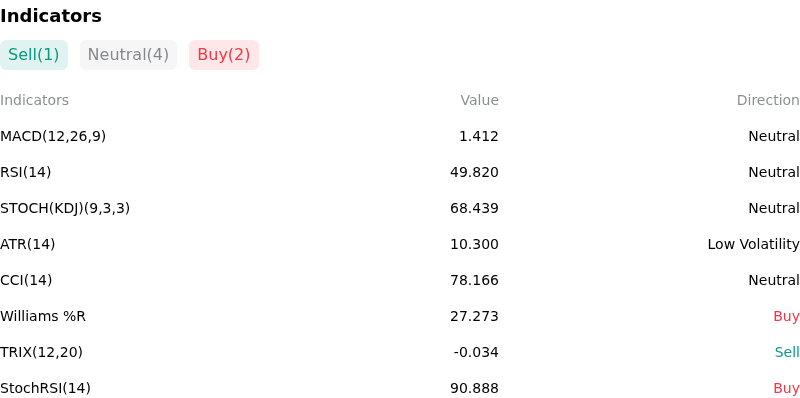
Technically, BNB (BNBUSD) shows a MACD (12,26,9) value of 1.412, indicating a neutral signal. The RSI at 49.820 suggests neutral condition and the Williams %R at 27.273 suggests buy condition. Please monitor closely.
More details about BNB (BNBUSD)
Recent Events and Risks:
- Regulatory and Geopolitical Uncertainty: The ongoing legal confrontation between Binance and the SEC, alongside the prolonged detention of a Binance executive in Nigeria, continues to exert downward pressure on BNB as market participants remain wary of further enforcement actions or hefty financial penalties that could impact exchange operations.
- Launchpool Unstaking Volatility: Following the completion of recent ecosystem incentives and Launchpool farming periods, the market faces a recurring risk of localized sell-offs as participants unstake and liquidate BNB holdings to reclaim liquidity, often leading to intraday price corrections.
- Ecosystem Competition and Fee Revenue Declines: BNB Smart Chain (BSC) faces increasing competition for on-chain activity from Layer 2 solutions and Solana, resulting in stagnant Total Value Locked (TVL) and reduced transaction fee generation, which diminishes the fundamental demand for BNB as a utility and gas token.
- Concentrated Exchange Risk: Due to the high degree of centralization and BNB’s role as the primary collateral within the Binance ecosystem, any perceived weakness in the exchange’s liquidity or sudden shifts in market maker activity can trigger disproportionate volatility and cascading liquidations in leveraged BNB pairs.
Recommended Articles


