


Micro Silver (XAGUSD-M) Is down 2.05% on Jul 28: Here Is Why
Micro Silver (XAGUSD-M) is down 2.05% at Jul 28 01:00(ET), now at $57.134, with a 7-day down of 2.74%.
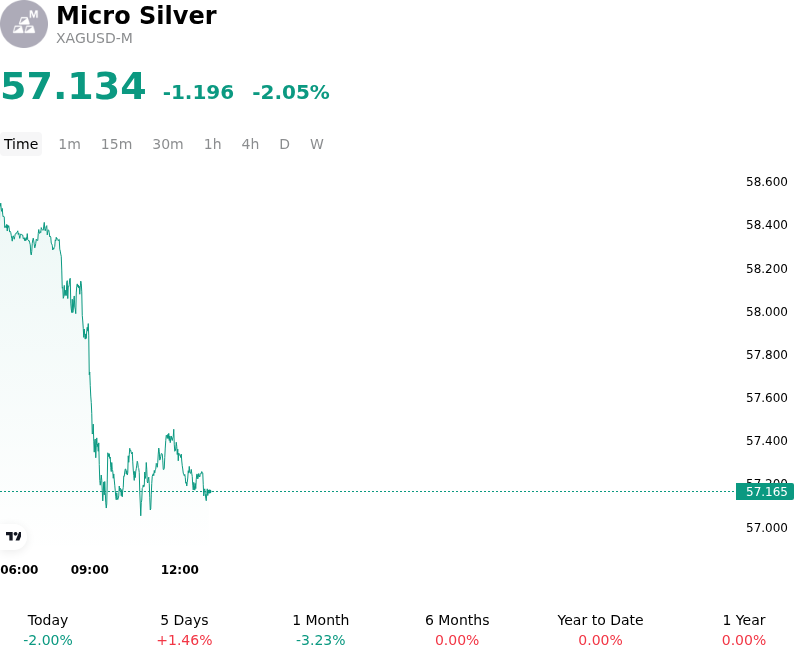
What is driving Micro Silver (XAGUSD-M)’s stock price down today?
The decline in silver prices is primarily driven by a sharp repricing of U.S. interest rate expectations following unexpected resilience in labor market data. This shift has prompted institutional investors to recalibrate the probability of further restrictive policy from the Federal Reserve throughout the second half of 2026. The subsequent rise in U.S. real yields has increased the opportunity cost of holding non-yielding assets, leading to a rotation out of precious metals. The strengthening of the U.S. dollar has further pressured silver, making it more expensive for holders of other currencies and dampening international spot demand.
Silver’s dual identity as an industrial metal has exacerbated its underperformance during this session. Recent manufacturing data from major industrial hubs indicates a slowdown in the production of electronics and photovoltaic components. Given that the solar energy sector has become a primary driver of structural silver demand, reports of rising inventories in solar cells and a deceleration in new installations have led to a downward revision in global industrial consumption forecasts for the current quarter. This softening in demand expectations is weighing heavily on the market balance, which had previously been supported by supply deficit narratives.
From a technical and institutional perspective, the price action reflects significant long-liquidation among Commodity Trading Advisors and macro hedge funds. The breach of key technical support levels triggered a cascade of automated sell orders, accelerating the downward momentum. Unlike gold, which often finds support from central bank diversification during periods of volatility, silver remains more exposed to shifts in global manufacturing sentiment and liquidity conditions.
Geopolitical factors, which had previously provided a risk premium for the metals complex, have momentarily receded in significance, leaving silver vulnerable to the broader macroeconomic environment. Market participants are now closely monitoring upcoming manufacturing PMI releases and Federal Reserve communications for signs of industrial stabilization or a pivot in monetary rhetoric. Until there is a clear stabilization in real yields or a resurgence in industrial orders, the outlook for silver remains constrained by high carrying costs and cooling demand in the energy transition sector.
Technical Analysis of Micro Silver (XAGUSD-M)
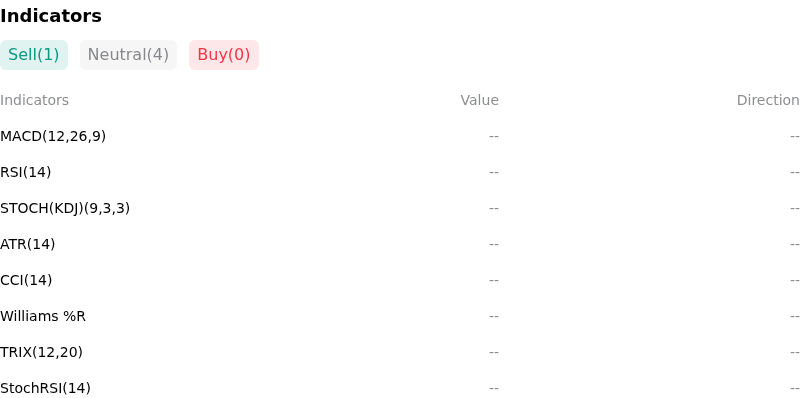
Technically, Micro Silver (XAGUSD-M) shows a MACD (12,26,9) value of 0.000, indicating a neutral signal. The RSI at 39.391 suggests neutral condition and the Williams %R at 60.581 suggests sell condition. Please monitor closely.
More details about Micro Silver (XAGUSD-M)
Recent Events and Risks:
- U.S. Dollar and Yield Resilience: Persistent strength in the U.S. Dollar Index and rising 10-year Treasury yields over the last 48 hours have intensified downside pressure on silver, as the higher opportunity cost of holding non-yielding bullion triggers systematic selling across the XAGUSD complex.
- Industrial Demand Contraction: Recent manufacturing data and slowing growth signals from the Chinese solar energy sector have raised concerns about a reduction in silver's primary industrial consumption, leading to a bearish outlook for physical demand in the near term.
- Inventory Accumulation and Positioning: A recent increase in exchange-monitored silver stocks, coupled with evidence of long-liquidation by managed money participants following a failure to hold key psychological resistance levels, has created a liquidity vacuum that exacerbates intraday price drops.
- Gold-Silver Ratio Expansion: Silver's higher beta relative to gold has led to magnified losses during the current macro risk-off environment, as institutional investors trim exposure to high-volatility silver faster than defensive gold assets during periods of equity market uncertainty.
Recommended Articles


