


USD/CHF (USDCHF) Drops 0.80% on Jul 14: What You Need to Watch
USD/CHF (USDCHF) is down 0.80% at Jul 14 08:35(ET), now at $0.80738, with a 7-day down of 0.00%.
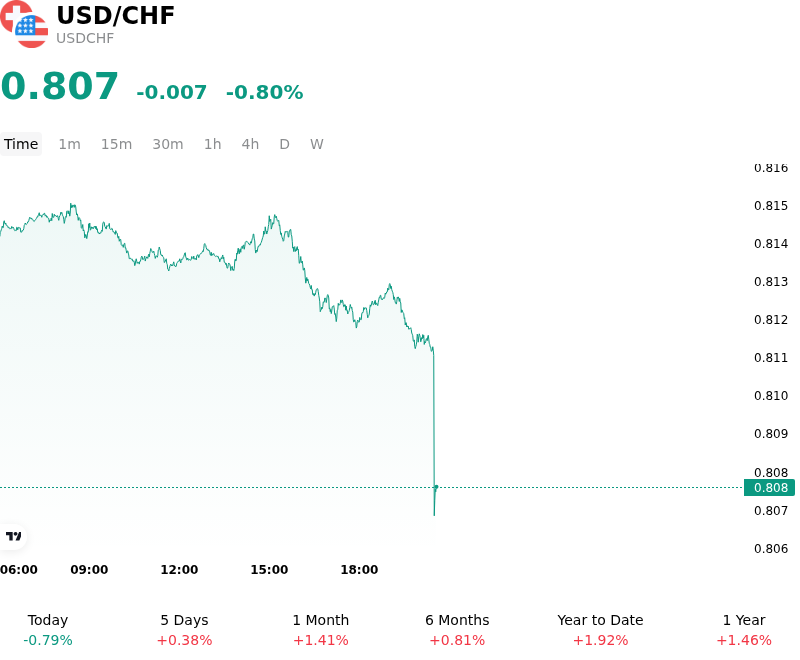
What is driving USD/CHF (USDCHF)’s stock price down today?
The decline in USDCHF is primarily driven by a sharp repricing of Federal Reserve interest rate expectations following softer-than-anticipated US inflation data. The cooler consumer price index print has triggered a broad retreat in US Treasury yields, particularly at the front end of the curve, which has significantly narrowed the interest rate differential between the US Dollar and the Swiss Franc. As institutional investors transition toward a narrative of an accelerated Fed easing cycle, the US Dollar has lost the yield-support that had previously underpinned its strength.
Simultaneously, the Swiss Franc has seen a pronounced increase in safe-haven demand. Renewed geopolitical tensions and concerns regarding fiscal stability in major developed economies have prompted a rotation into high-quality, low-beta assets. The Swiss Franc remains a primary beneficiary of this risk-off sentiment. Furthermore, the Swiss National Bank’s perceived shift toward prioritizing price stability over currency devaluation has reduced the risk of immediate intervention, emboldening market participants to increase Franc exposure.
The move also reflects a broader unwinding of carry trades. With US yields compressing and the Swiss Franc exhibiting strong momentum, the risk-adjusted returns for maintaining short-Franc positions have deteriorated. This has led to a wave of speculative position squaring, which has added downward pressure to the currency pair. The relative resilience of the Swiss economy, characterized by lower domestic inflation compared to its G10 peers, further supports the Franc’s appreciation as real interest rate differentials move in its favor.
In the current environment, the downward trajectory of USDCHF appears to be supported by a fundamental shift in macro expectations rather than a temporary technical correction. The market is now pricing in a period of policy divergence where the Federal Reserve is forced to be more reactive to slowing growth and cooling inflation, while the SNB maintains a more neutral and defensive stance. Investors are likely to remain cautious, focusing on upcoming central bank communications to determine if this structural shift in capital flows will be sustained over the medium term.
Technical Analysis of USD/CHF (USDCHF)
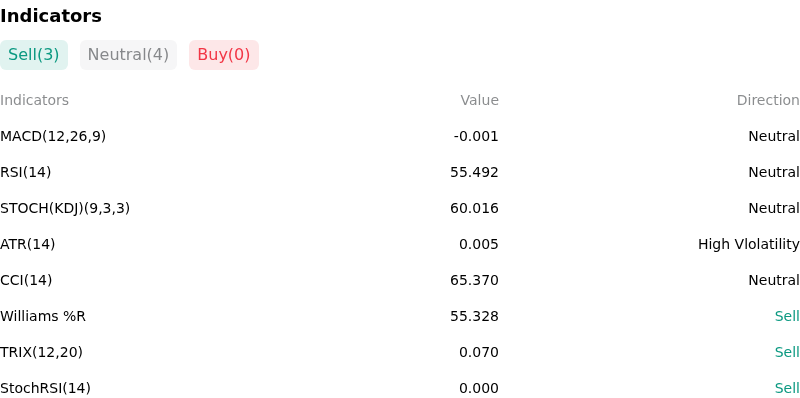
Technically, USD/CHF (USDCHF) shows a MACD (12,26,9) value of -0.001, indicating a neutral signal. The RSI at 55.492 suggests neutral condition and the Williams %R at 55.328 suggests sell condition. Please monitor closely.
More details about USD/CHF (USDCHF)
Recent Events and Risks:
- Safe-Haven Demand Amid European Political Risk: Ongoing uncertainty regarding the French legislative elections has triggered a flight to safety, disproportionately benefiting the Swiss Franc as a regional hedge and exerting downward pressure on the USD/CHF pair.
- Softening U.S. Macroeconomic Data: Recent releases of weaker-than-anticipated U.S. retail sales and lower-than-expected manufacturing activity have increased market bets for a Federal Reserve rate cut as early as September, narrowing the yield differential between the Greenback and the Franc.
- SNB Policy Ambiguity and Intervention Risks: Following the Swiss National Bank's June interest rate cut to 1.25%, SNB Chairman Thomas Jordan’s comments regarding the willingness to adjust foreign exchange interventions have caused market participants to remain wary of sudden CHF appreciation if the bank shifts its focus back to curbing imported inflation.
- Unwinding of Carry Trade Positions: A recent dip in global risk appetite and a decline in U.S. Treasury yields have prompted traders to reduce exposure to higher-yielding assets, leading to an unwind of short-CHF carry trade positions and resulting in rapid intraday spikes in Franc strength against the Dollar.
Recommended Articles


