


Gold clings to $4,000 as traders brace for US CPI
- Gold holds above the $4,000 mark as traders await the US CPI report for June.
- Renewed US-Iran tensions lift Oil prices and revive concerns over energy-driven inflation.
- Technically, Gold remains under pressure, with the RSI remaining below the neutral level.
Gold (XAU/USD) trades in a narrow range on Tuesday, with bulls defending the $4,000 psychological mark as traders await the US June Consumer Price Index (CPI) data, due at 12:30 GMT, and closely monitor the fragile situation in the Middle East.
At the time of writing, XAU/USD trades around $4,020, up nearly 0.45% on the day after touching a two-week low of $3,983 earlier in the Asian session.
Headline CPI is expected to ease to 3.8% YoY from 4.2% in May, while the monthly reading is forecast to decline 0.1% after rising 0.5%. Core CPI, which strips out volatile food and energy prices, is forecast to rise 0.2% MoM and 2.8% YoY, broadly matching May’s readings.
“If we get another hot reading on core inflation this week, then the FOMC will need to consider tightening monetary policy in the near term,” Fed Governor Christopher Waller said on Monday.
According to the CME FedWatch Tool, traders are now pricing in a 40% chance of a rate hike at the July meeting, up from 26% a week ago, while the probability of a September hike has risen to 74%.
Later in the American session, traders will turn their attention to Fed Chair Kevin Warsh’s congressional testimony. Speeches from Fed officials Michael Barr, Austan Goolsbee and Lisa Cook will also be closely watched.
Renewed tensions between the US and Iran have pushed crude Oil prices to a one-month high. West Texas Intermediate (WTI) trades around $80.00, up around 12% so far this week.
The US carried out strikes against Iran for a third consecutive night on Monday. US President Donald Trump also said he was reinstating a naval blockade on Iran, which will take effect at 20:00 GMT on Tuesday. Trump added that other countries could continue using the Strait of Hormuz but would face a 20% security fee.
Iran's top joint military command said the US had no role in determining the future of Hormuz and would not be allowed to intervene in the strait.
The latest escalation has shifted attention back to the inflationary impact of rising Oil prices. With markets expecting the Fed to raise interest rates later this year, Gold’s near-term bias remains bearish.
Technical analysis: XAU/USD attempts to stabilize within a bearish setup
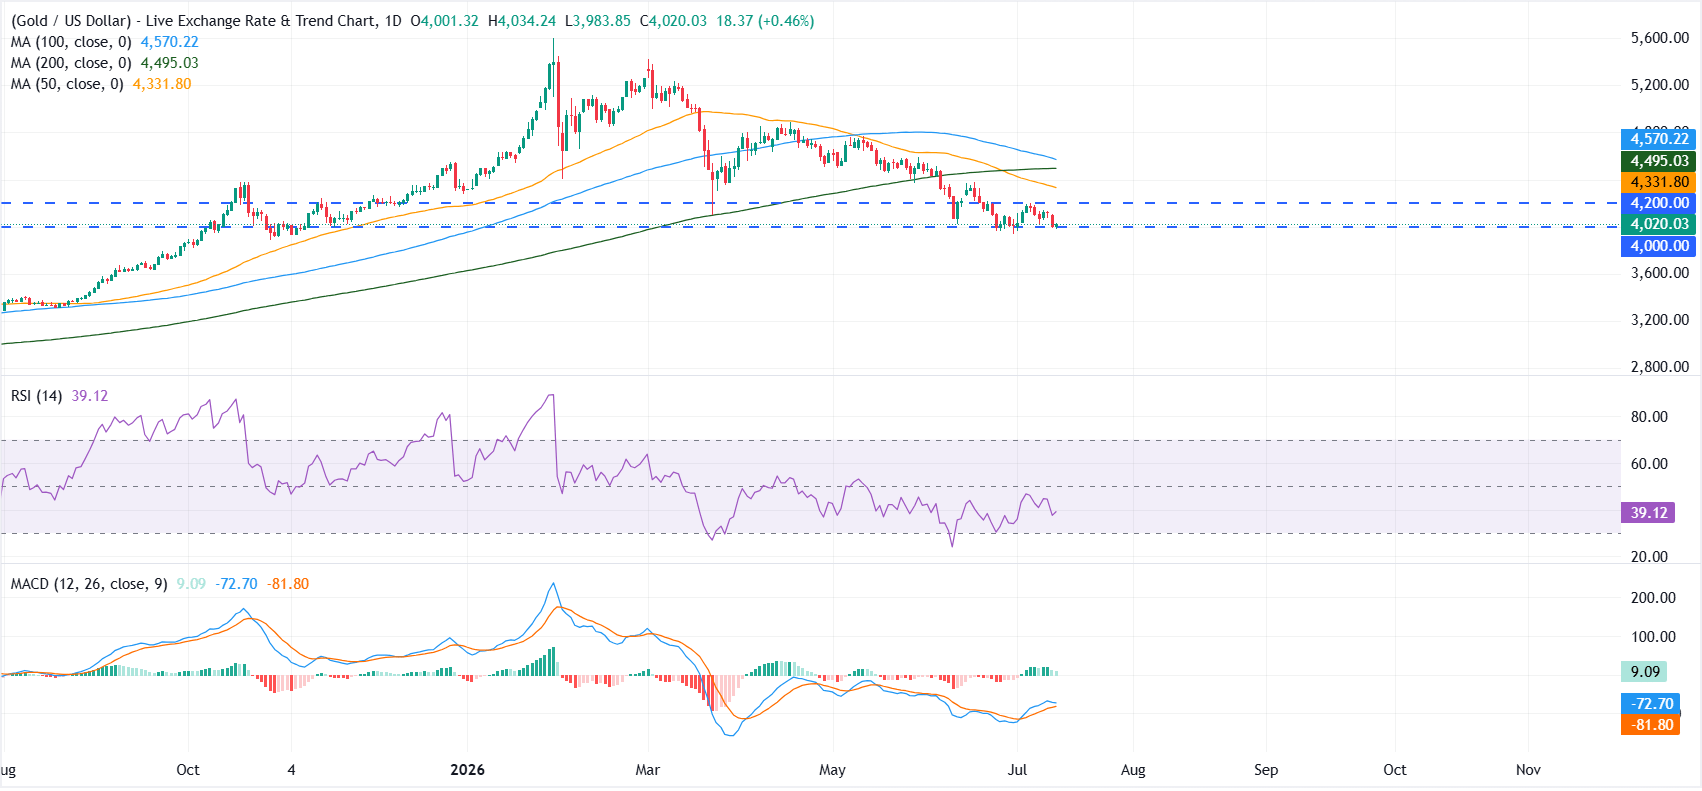
On the daily chart, XAU/USD maintains a bearish bias, trading below the 50-day, 100-day and 200-day Simple Moving Averages (SMAs).
Gold is attempting to stabilize above the $4,000 psychological mark, but momentum remains weak. The Relative Strength Index (RSI) is near 39, while the Moving Average Convergence Divergence (MACD) remains modestly positive, suggesting that selling pressure may be easing but does not yet indicate a clear bullish reversal.
On the upside, initial resistance is at $4,200, followed by the 50-day SMA at $4,331. The 200-day SMA at $4,495 and the 100-day SMA at $4,570 represent stronger barriers and reinforce the broader bearish structure.
Immediate support is located at the round $4,000 mark. A sustained break below this level could trigger renewed selling pressure, while Gold would need to reclaim $4,200 to ease the current bearish bias.
(The technical analysis of this story was written with the help of an AI tool. Know more.)
Inflation FAQs
Inflation measures the rise in the price of a representative basket of goods and services. Headline inflation is usually expressed as a percentage change on a month-on-month (MoM) and year-on-year (YoY) basis. Core inflation excludes more volatile elements such as food and fuel which can fluctuate because of geopolitical and seasonal factors. Core inflation is the figure economists focus on and is the level targeted by central banks, which are mandated to keep inflation at a manageable level, usually around 2%.
The Consumer Price Index (CPI) measures the change in prices of a basket of goods and services over a period of time. It is usually expressed as a percentage change on a month-on-month (MoM) and year-on-year (YoY) basis. Core CPI is the figure targeted by central banks as it excludes volatile food and fuel inputs. When Core CPI rises above 2% it usually results in higher interest rates and vice versa when it falls below 2%. Since higher interest rates are positive for a currency, higher inflation usually results in a stronger currency. The opposite is true when inflation falls.
Although it may seem counter-intuitive, high inflation in a country pushes up the value of its currency and vice versa for lower inflation. This is because the central bank will normally raise interest rates to combat the higher inflation, which attract more global capital inflows from investors looking for a lucrative place to park their money.
Formerly, Gold was the asset investors turned to in times of high inflation because it preserved its value, and whilst investors will often still buy Gold for its safe-haven properties in times of extreme market turmoil, this is not the case most of the time. This is because when inflation is high, central banks will put up interest rates to combat it. Higher interest rates are negative for Gold because they increase the opportunity-cost of holding Gold vis-a-vis an interest-bearing asset or placing the money in a cash deposit account. On the flipside, lower inflation tends to be positive for Gold as it brings interest rates down, making the bright metal a more viable investment alternative.
Recommended Articles


