


Ethereum (ETHUSD) Volatility Intensified on Jul 13: What You Should Know
Ethereum (ETHUSD) is down 2.39% at Jul 13 00:05(ET), now at $1775.34, with a 7-day down of 0.85%.
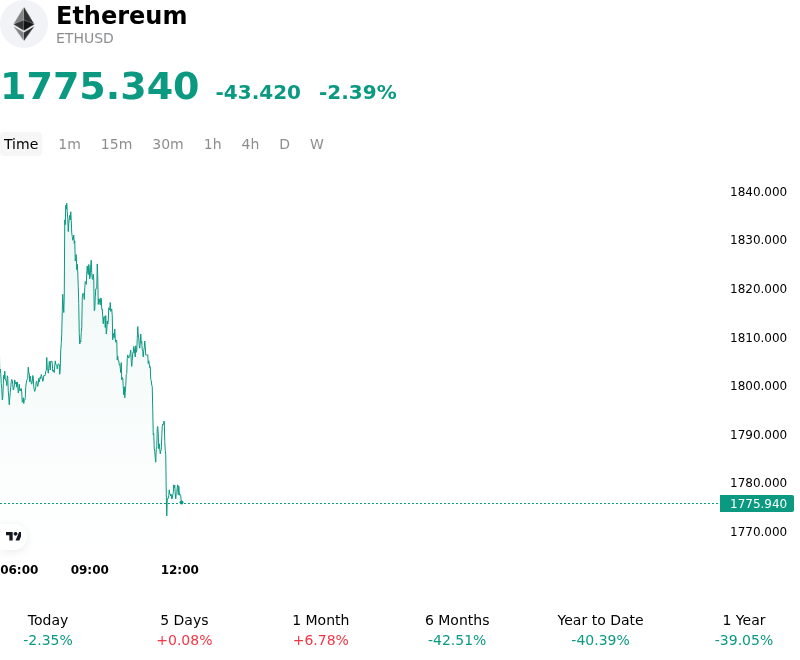
What is driving Ethereum (ETHUSD)’s stock price down today?
The downward pressure on Ethereum is primarily driven by a shift in global macro liquidity conditions and a notable cooling of institutional appetite within the spot ETF market. As market participants recalibrate their expectations for the Federal Reserve’s terminal rate, a moderate uptick in U.S. Treasury yields has incentivized a flight to quality, drawing capital away from high-beta digital assets. This tightening of financial conditions has reinforced the strength of the U.S. Dollar, creating a direct headwind for ETHUSD as investors demand a higher risk premium for holding decentralized platform assets.
Institutional flow data suggests that net outflows from Ethereum-based exchange-traded products have accelerated, marking a pause in the steady accumulation seen earlier in the quarter. This institutional de-risking appears to be a response to plateauing growth in decentralized finance (DeFi) total value locked and a temporary slowdown in Layer-2 network activity. As institutional investors prioritize liquidity and capital preservation, the lack of immediate network-specific catalysts has left the asset vulnerable to broader market volatility.
On-chain metrics further reflect this cautious sentiment, with a discernible increase in ETH deposits to centralized exchanges, signaling a potential build-up of sell-side pressure from larger holders. In the derivatives market, the funding rate for Ethereum perpetual futures has dipped into neutral territory, indicating that the previous bullish bias has dissipated. A series of long liquidations in the early trading hours exacerbated the decline, as leveraged positions were forced closed during a period of thinner intraday liquidity.
Furthermore, the regulatory environment continues to weigh on investor psychology. Persistent uncertainty regarding the classification of certain liquid staking derivatives and the intensifying scrutiny of cross-chain infrastructure have prompted more conservative positioning among risk-managed funds. Until there is a clearer signal from either a pivot in monetary policy or a renewed surge in ecosystem-level adoption, Ethereum remains sensitive to technical breakdown levels and macro-driven capital rotations.
Technical Analysis of Ethereum (ETHUSD)
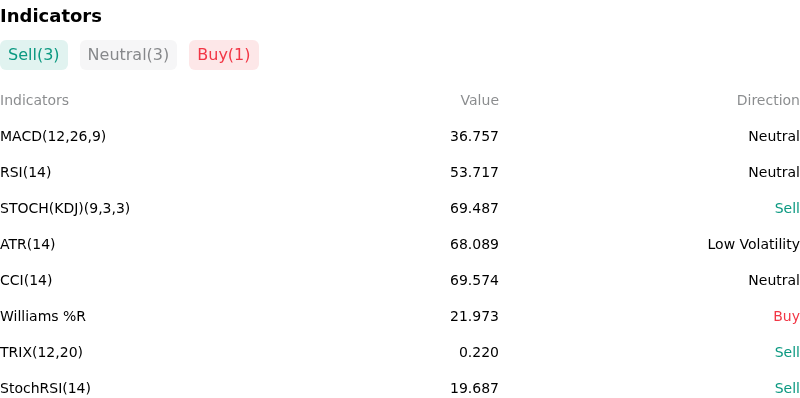
Technically, Ethereum (ETHUSD) shows a MACD (12,26,9) value of 36.757, indicating a neutral signal. The RSI at 53.717 suggests neutral condition and the Williams %R at 21.973 suggests buy condition. Please monitor closely.
More details about Ethereum (ETHUSD)
Recent Events and Risks:
- Spot ETF "Sell the News" Dynamics: Following the recent regulatory pivot regarding Spot Ether ETFs, traders are increasingly concerned about a "sell the news" event similar to the Bitcoin ETF launch, where initial institutional inflows may not immediately offset the liquidations from speculative long positions.
- Regulatory and Staking Uncertainty: Persistent ambiguity regarding the SEC’s stance on "Staking-as-a-Service" and the potential classification of staked ETH as a security continues to pose a significant downside risk, potentially leading to forced de-risking by U.S.-based institutional platforms.
- Foundation and Whale Sell-Side Pressure: On-chain tracking has identified significant ETH transfers from the Ethereum Foundation and several "ICO-era" whale wallets to centralized exchanges within the last 48 hours, signaling potential intent to liquidate large holdings and increase intraday overhead supply.
- Perpetual Market Overextension: A spike in funding rates for ETH perpetual futures suggests a crowded long trade; any failure to maintain current support levels could trigger a massive liquidation cascade, exacerbating price drawdowns through automated forced selling.
Recommended Articles


