


Dogecoin Price Prediction: DOGE risks deeper losses amid waning retail demand
- Dogecoin extends losses on Monday for the third consecutive day, heading toward the $0.0700 support level.
- Retail support wanes for DOGE as Open Interest declines and funding rates flip negative.
- DOGE must hold above the $0.0700 level to avoid a steeper correction toward $0.0641.
Dogecoin (DOGE) price edges lower on Monday for the third straight day, inching closer toward the $0.0700 support level. Derivatives data signal easing retail demand for DOGE as the broader market risk-off sentiment remains elevated. The meme coin risks further decline below $0.0700 as momentum indicators continue to show sell-side dominance.
Market sentiment weighs on DOGE futures
Dogecoin, the oldest and largest meme coin in the crypto market, with a valuation over $12 billion, is losing retail support in the near term. The broader market risk-off sentiment stays elevated as tensions between the US and Iran over the Strait of Hormuz continue.
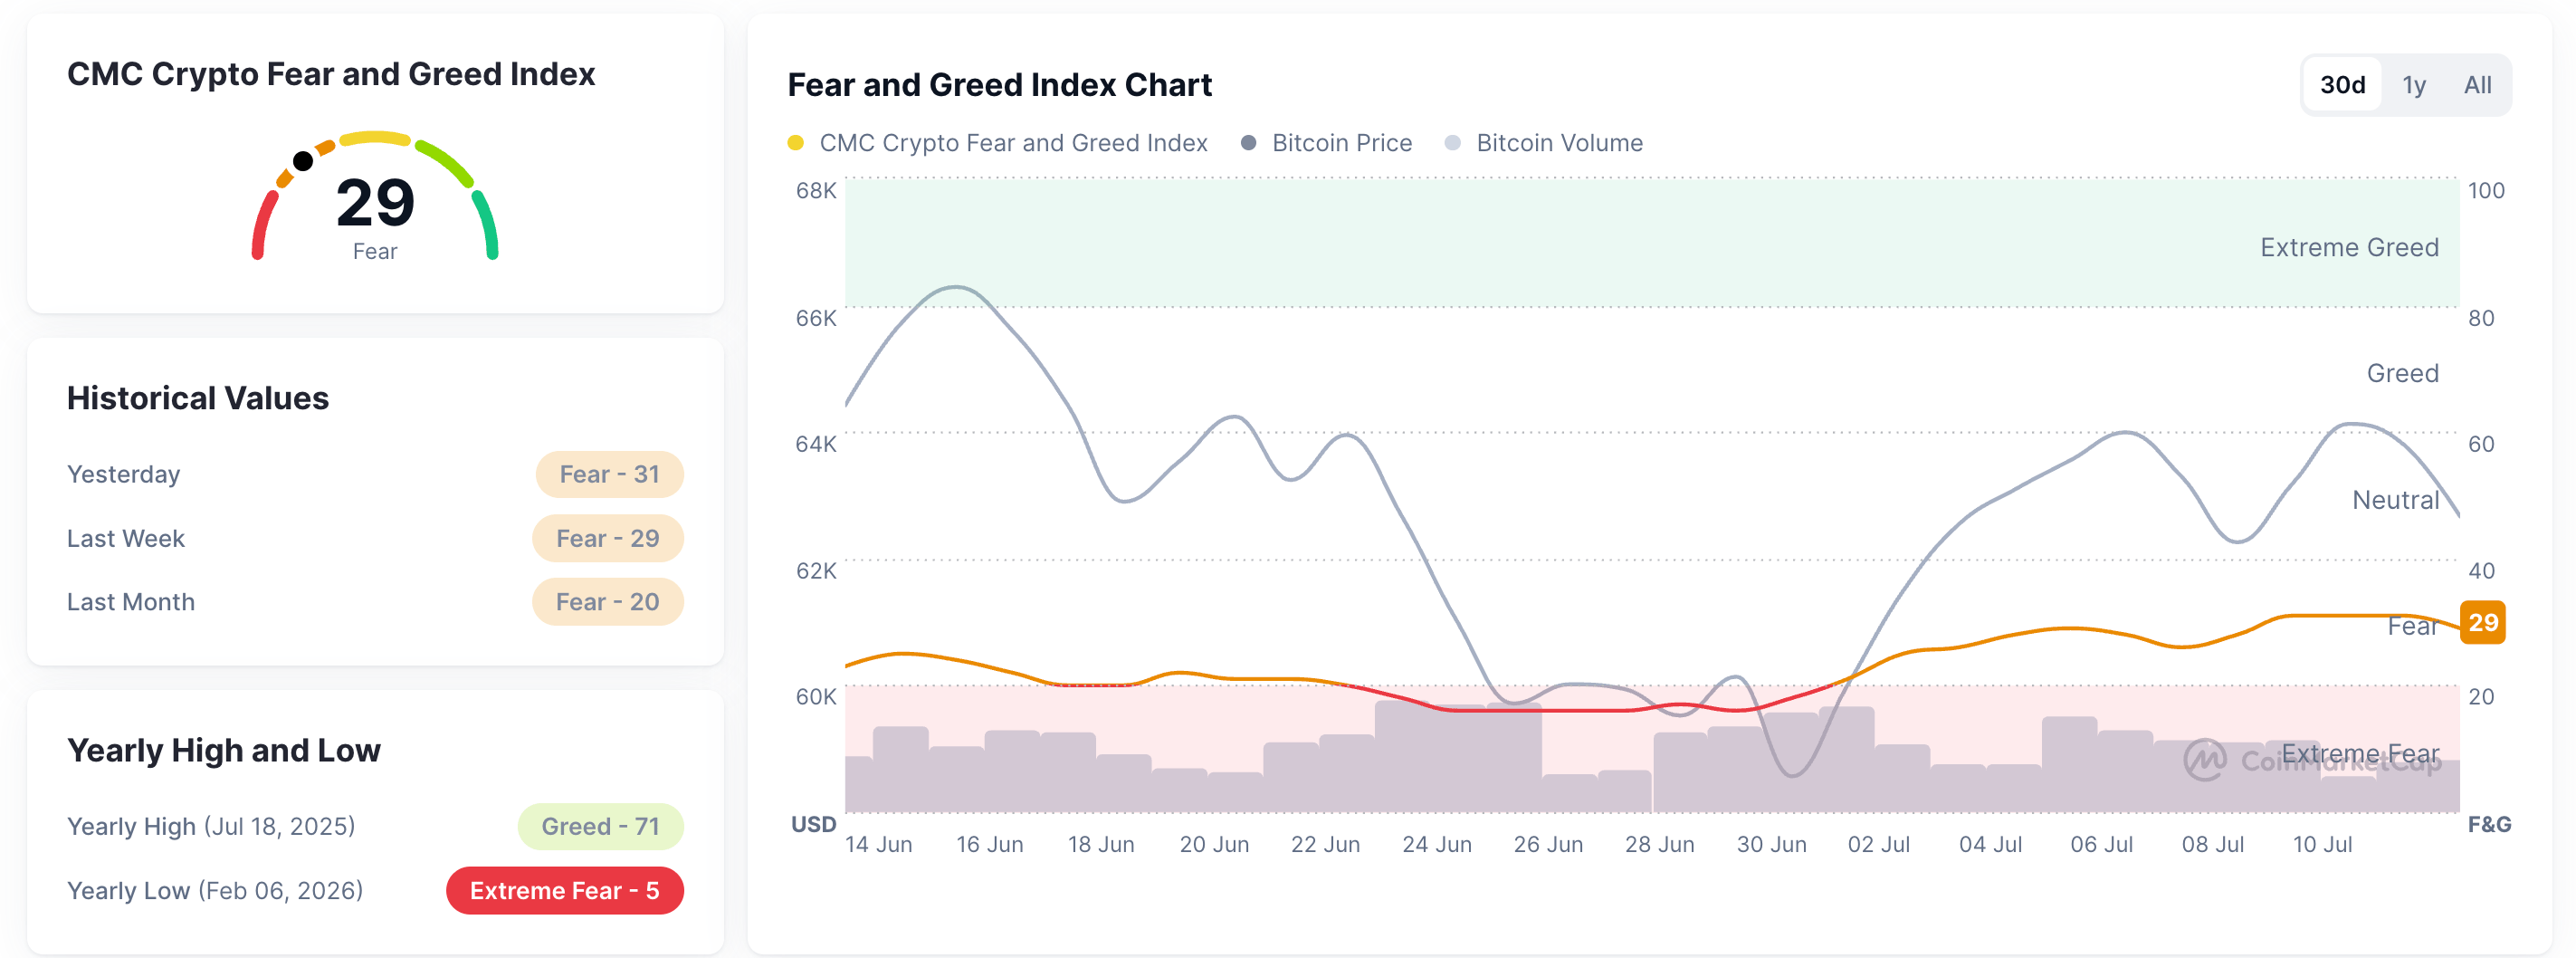
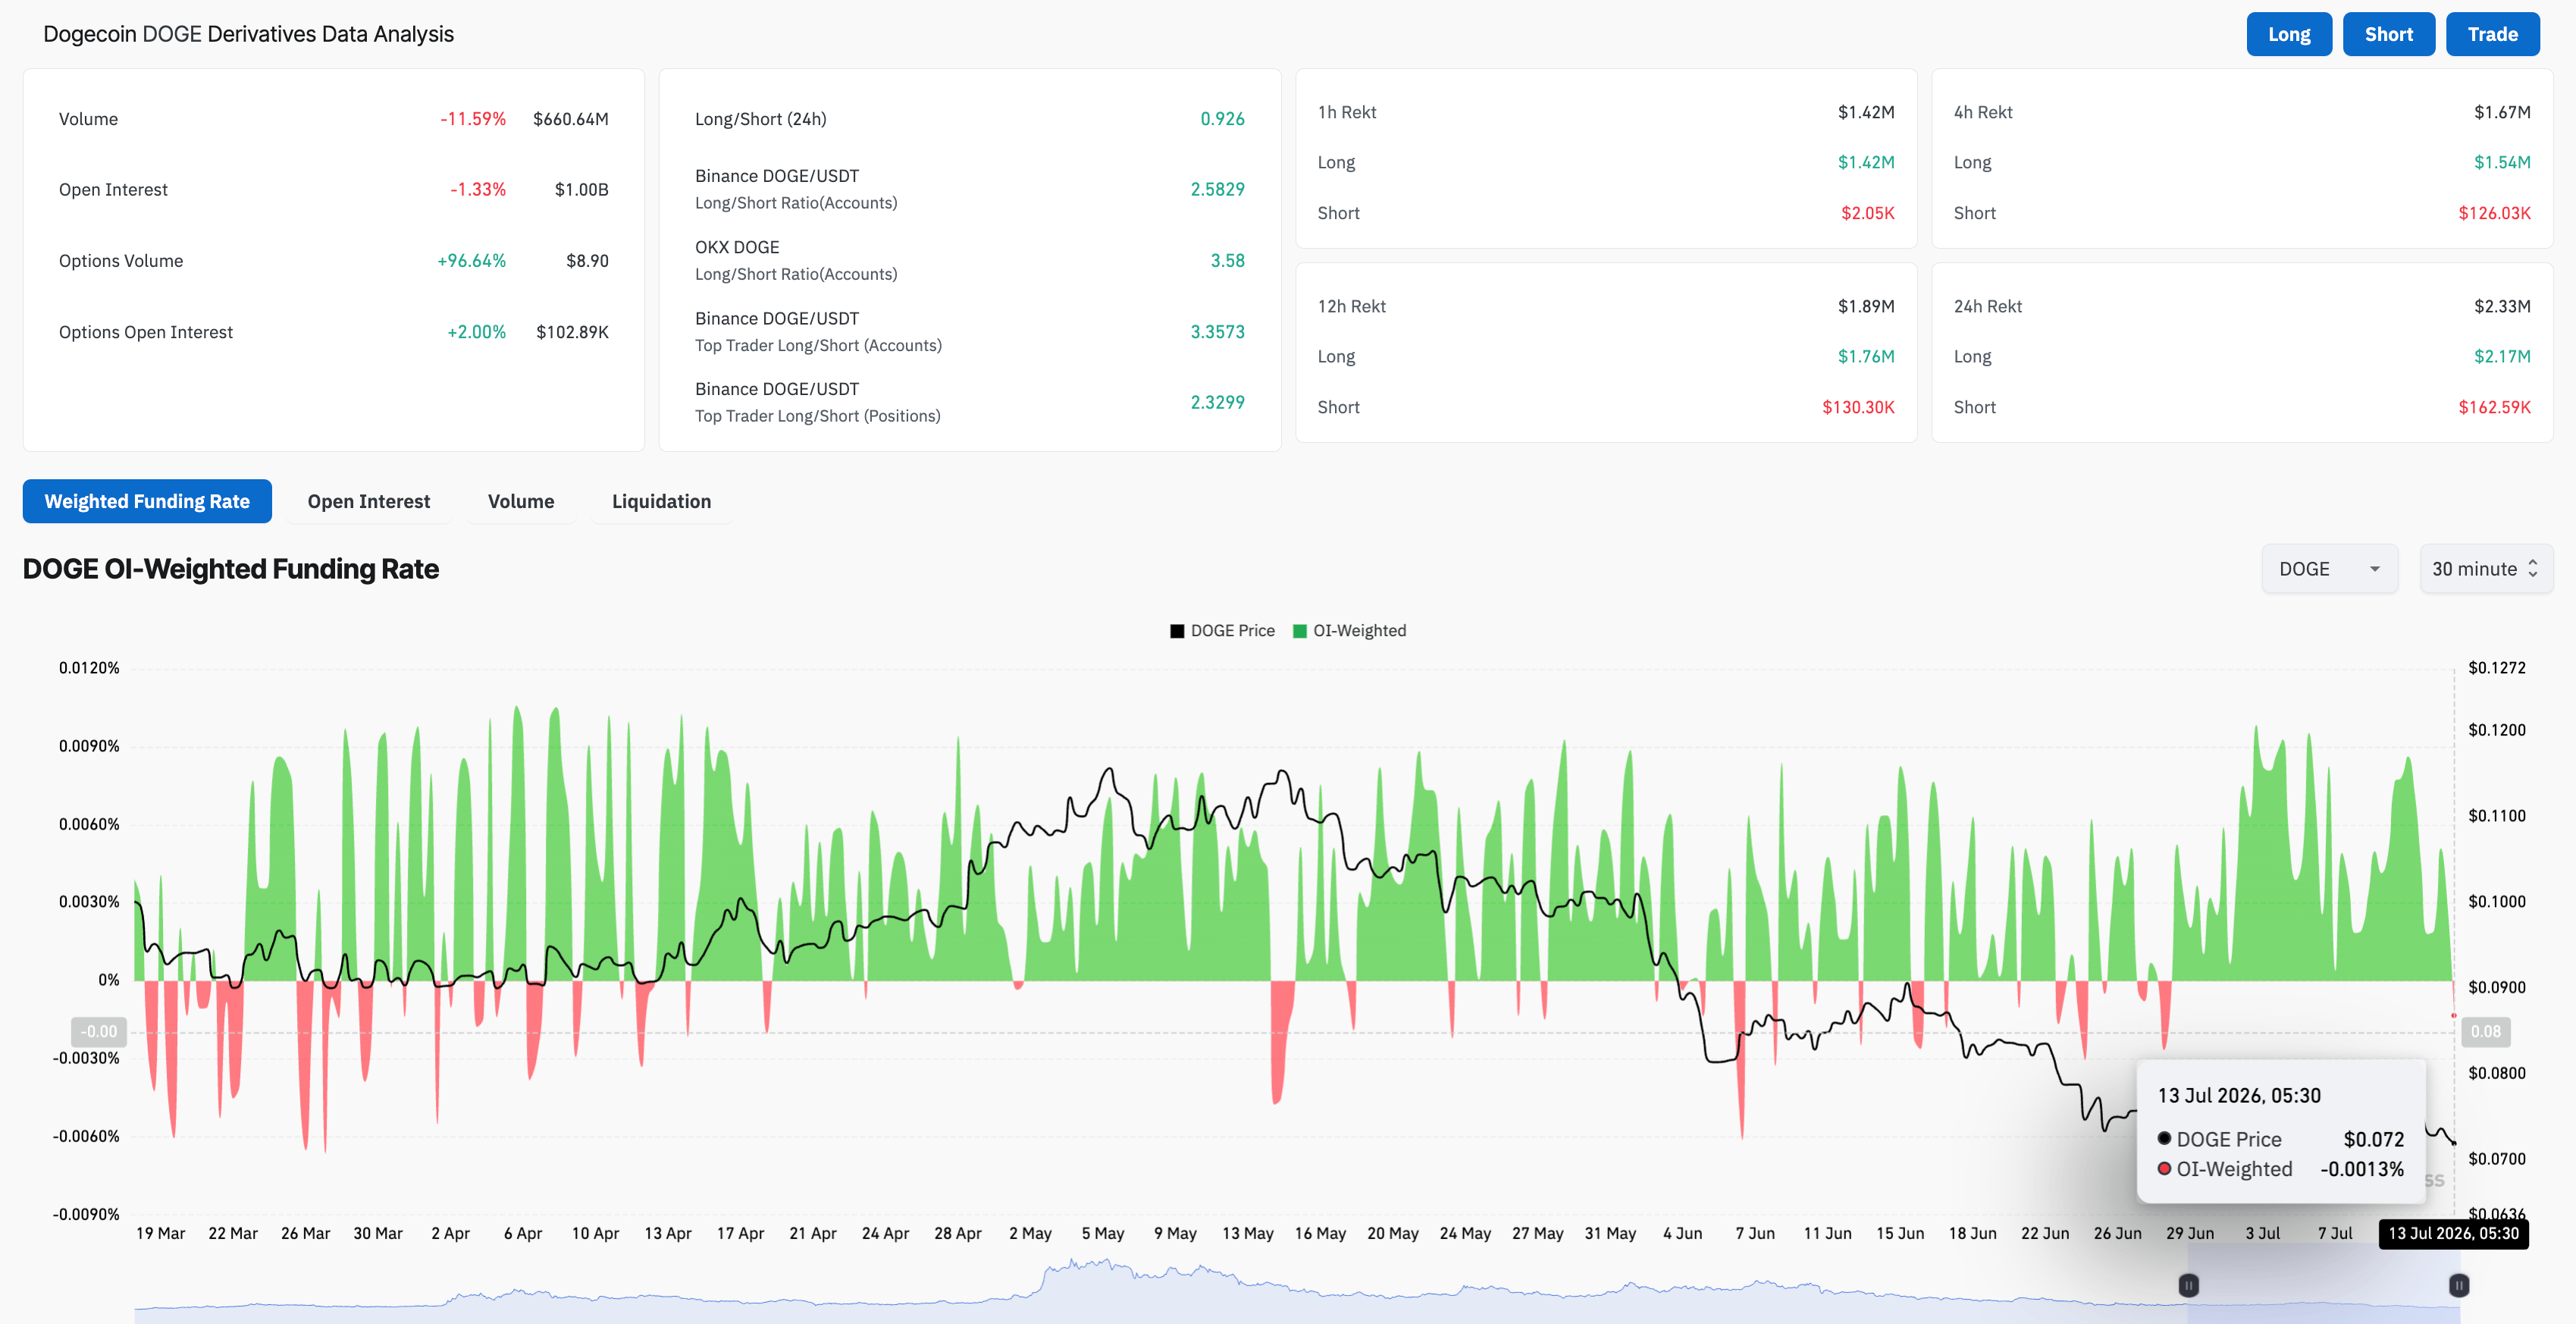
CoinMarketCap’s Crypto Fear and Greed Index at 29 on Monday remains in the “Fear” zone, reaffirming the broader market reduced risk appetite thesis. Meanwhile, CoinGlass data show that DOGE futures Open Interest (OI) has slipped by over 1% in the last 24 hours to $1.00 billion, indicating fewer active positions. At the same time, bullish sentiment among traders to buy the dip has faded, with the DOGE funding rate flipping negative to -.0013%, indicating buyers are willing to build short positions.
In addition, the $2.33 million in liquidations during the same period is driven by $2.17 million in long liquidations, reaffirming the sell-side dominance.
Technical outlook: Will DOGE hold above $0.0700?
DOGE is trading in the red for the third straight day on Monday, extending a broader bearish bias as price holds beneath the 50-day Exponential Moving Ảverage (EMA) at roughly $0.0824 and well below the 200-day EMA near $0.1064.
The pair remains pressured by a descending trend line that most recently rejected advances around $0.0745, which now threatens a retest of the $0.0700 support level, last tested on June 30. A potential daily close below this level could test $0.0641, last seen in October 2023.
That said, the Relative Strength Index (RSI) hovers on the weak side near 33, suggesting lingering downside fatigue, while the Moving Average Convergence Divergence (MACD) sustains a mild recovery tone above its signal line. However, the waning positive histograms suggest a waning recovery tone, which, in the case of DOGE, indicates early signs of renewed bearish momentum.
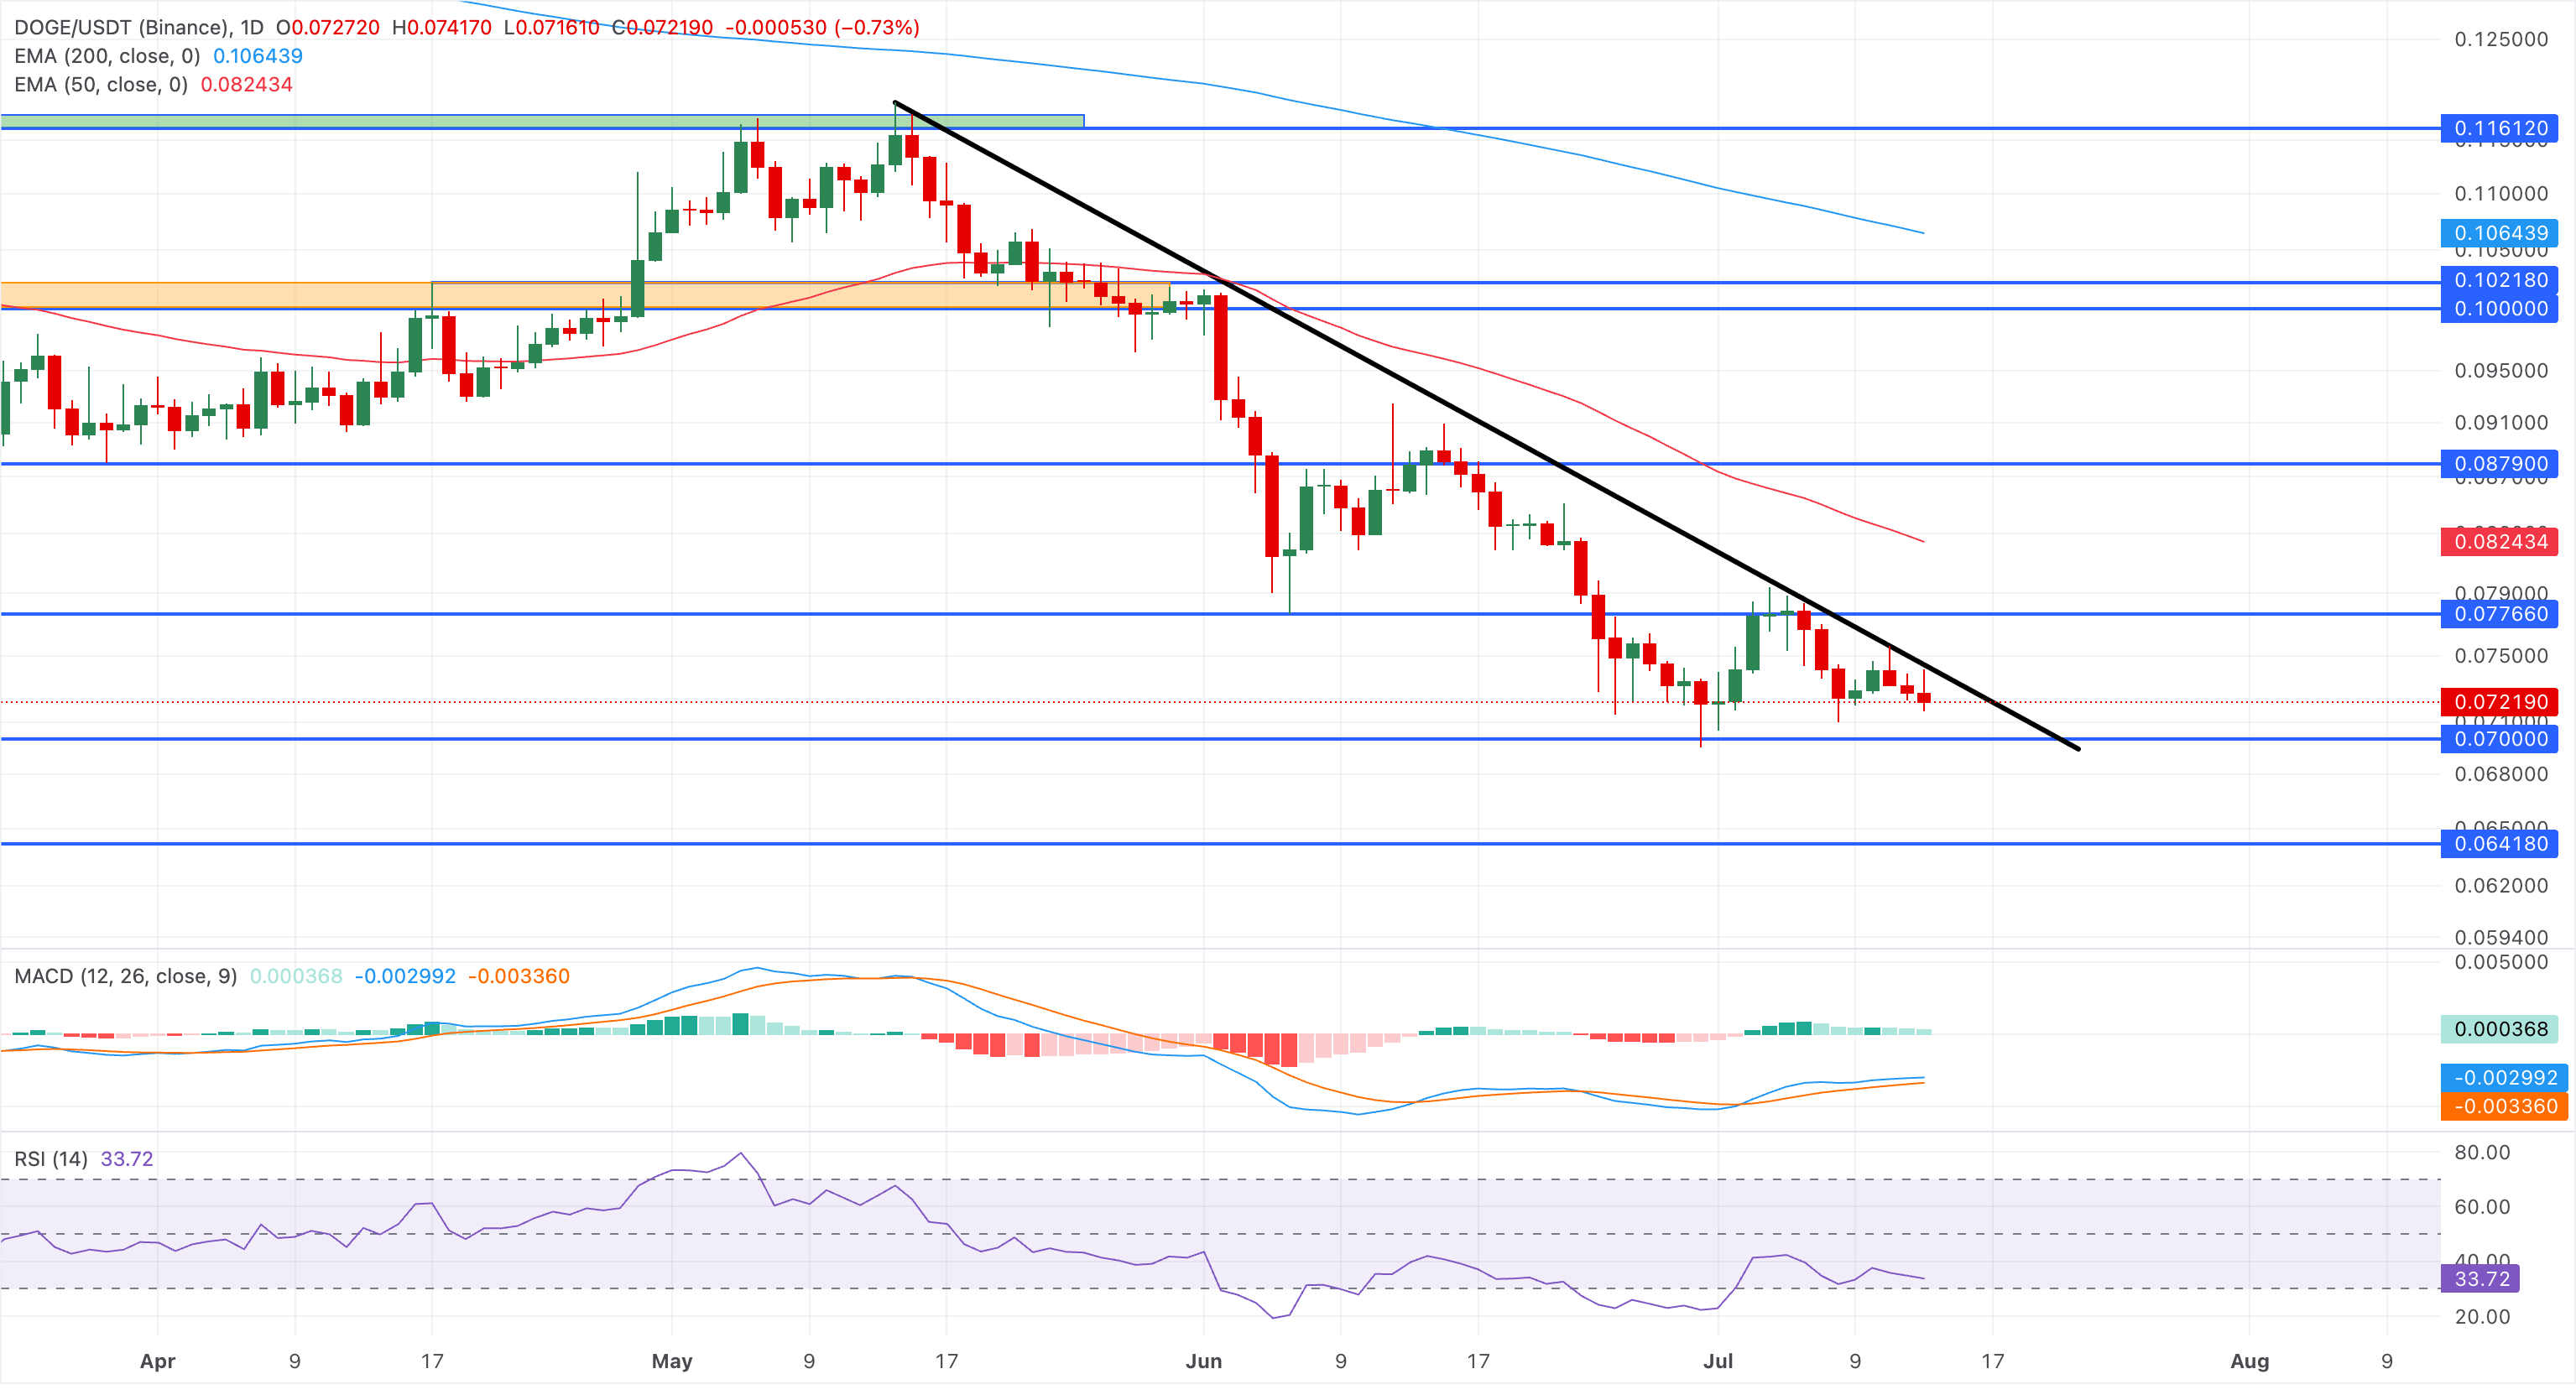
On the topside, initial resistance aligns with the descending trendline near $0.0745, followed by a horizontal cap at $0.0776 and the 50-day EMA at $0.0824, reinforcing a broader supply zone ahead of the $0.1000 psychological barrier.
(The technical analysis of this story was written with the help of an AI tool. Know more.)
Recommended Articles


