


Pi Network Price Forecast: Largest token unlock in July risk further losses as Pi2Day falls flat
- Pi Network extends losses for the sixth consecutive day, crossing below $0.50.
- The AI-powered Pi App Studio release on Pi2Day fails to boost bullish sentiment.
- Pi scan data shows 19.2 million tokens are scheduled to be unlocked in July, increasing the risks of a supply dump.
Pi Network (PI) continues to slide with a 3% drop at press time on Tuesday, printing its sixth consecutive bearish candle. The technical outlook indicates a bearish inclination in the days leading up to July’s biggest token unlock, while sentiment remains muted following the Pi2Day announcements.
Pi Network’s largest token unlock in July
PiScan data shows that 19.2 million PI tokens are set to be unlocked on July 4, marking the largest unlock of the month. Typically, token unlocks boost the available supply in the market, increasing the risk of a potential sell-off in the days after the event.
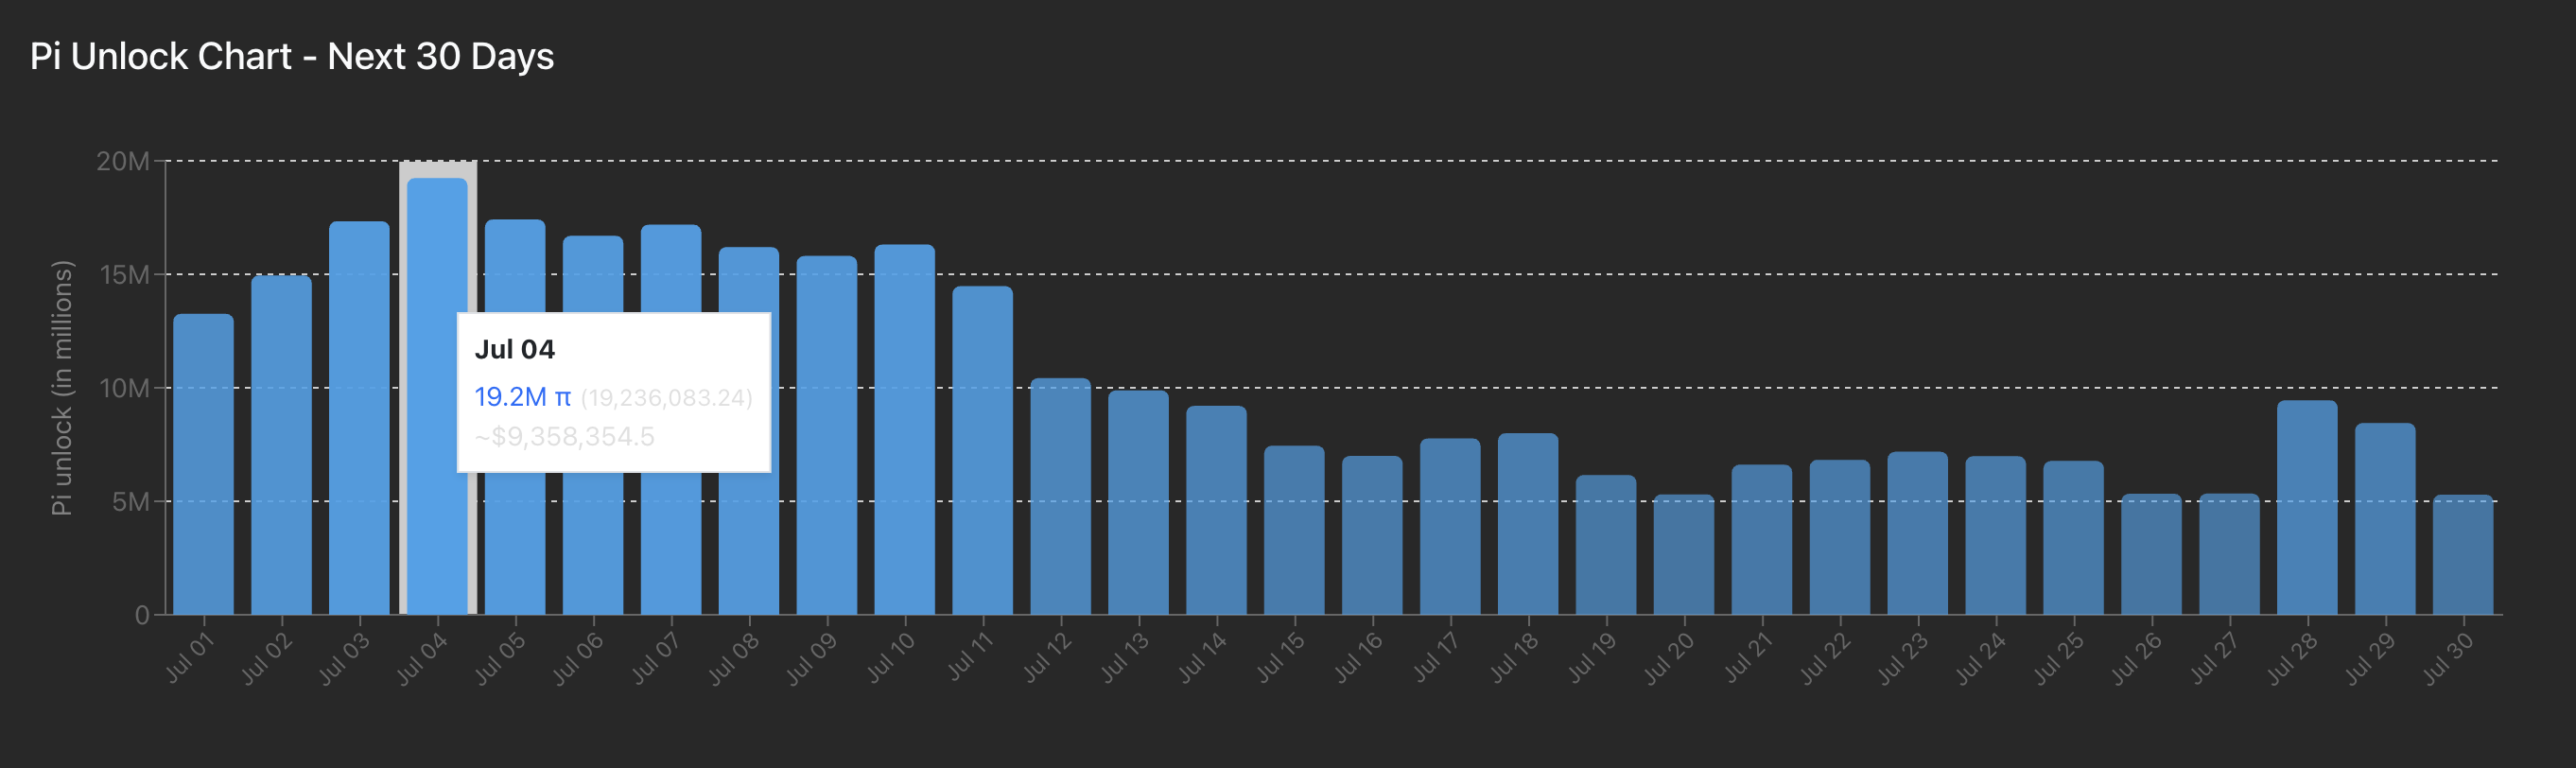
Pi token unlock chart. Source: PiScan
The sucessive token unlocks lined up in July account for a total of 268.4 million PI tokens, the highest monthly unlock until October 2027, as previously reported by FXStreet.
AI-powered no-code Pi App Studio released on Pi2Day
Pi Network released a Pi App Studio, a no-code platform to boost its ecosystem, on the highly anticipated Pi2Day on Saturday. The network also rolled out Ecosystem Directory Staking to increase an app's ranking by staking Pi tokens on the mainnet.
Despite multiple other minor updates, the Pi2Day announcements failed to boost Pi Network’s spot market performance.

Pi network risks further losses to $0.40
Pi Network edges lower by 3% at press time on Tuesday, extending the reversal run for the sixth consecutive day. Last week, Pi Network surged to $0.6667 before losing the gains and limiting its weekly growth to 5.94%.
As the declining trend nears the lowest price of June 22 at $0.4711, a potential daily close below it could extend the downfall to $0.4000, a support level that has been tested twice, on April 5 and June 13.
A daily close below $0.5031 would mark the lowest closing price since February 20 (listing day on OKX), thereby increasing the chances of a breakdown below $0.4711.
The Moving Average Convergence/Divergence (MACD) indicator displays the declining MACD line nearing its signal line, increasing the chances of a bearish crossover. A rise in the red histogram bar from the zero signal will trigger a sell signal.
The Relative Strength Index (RSI) at 35 declines closer towards the oversold boundary line, suggesting increased selling pressure.
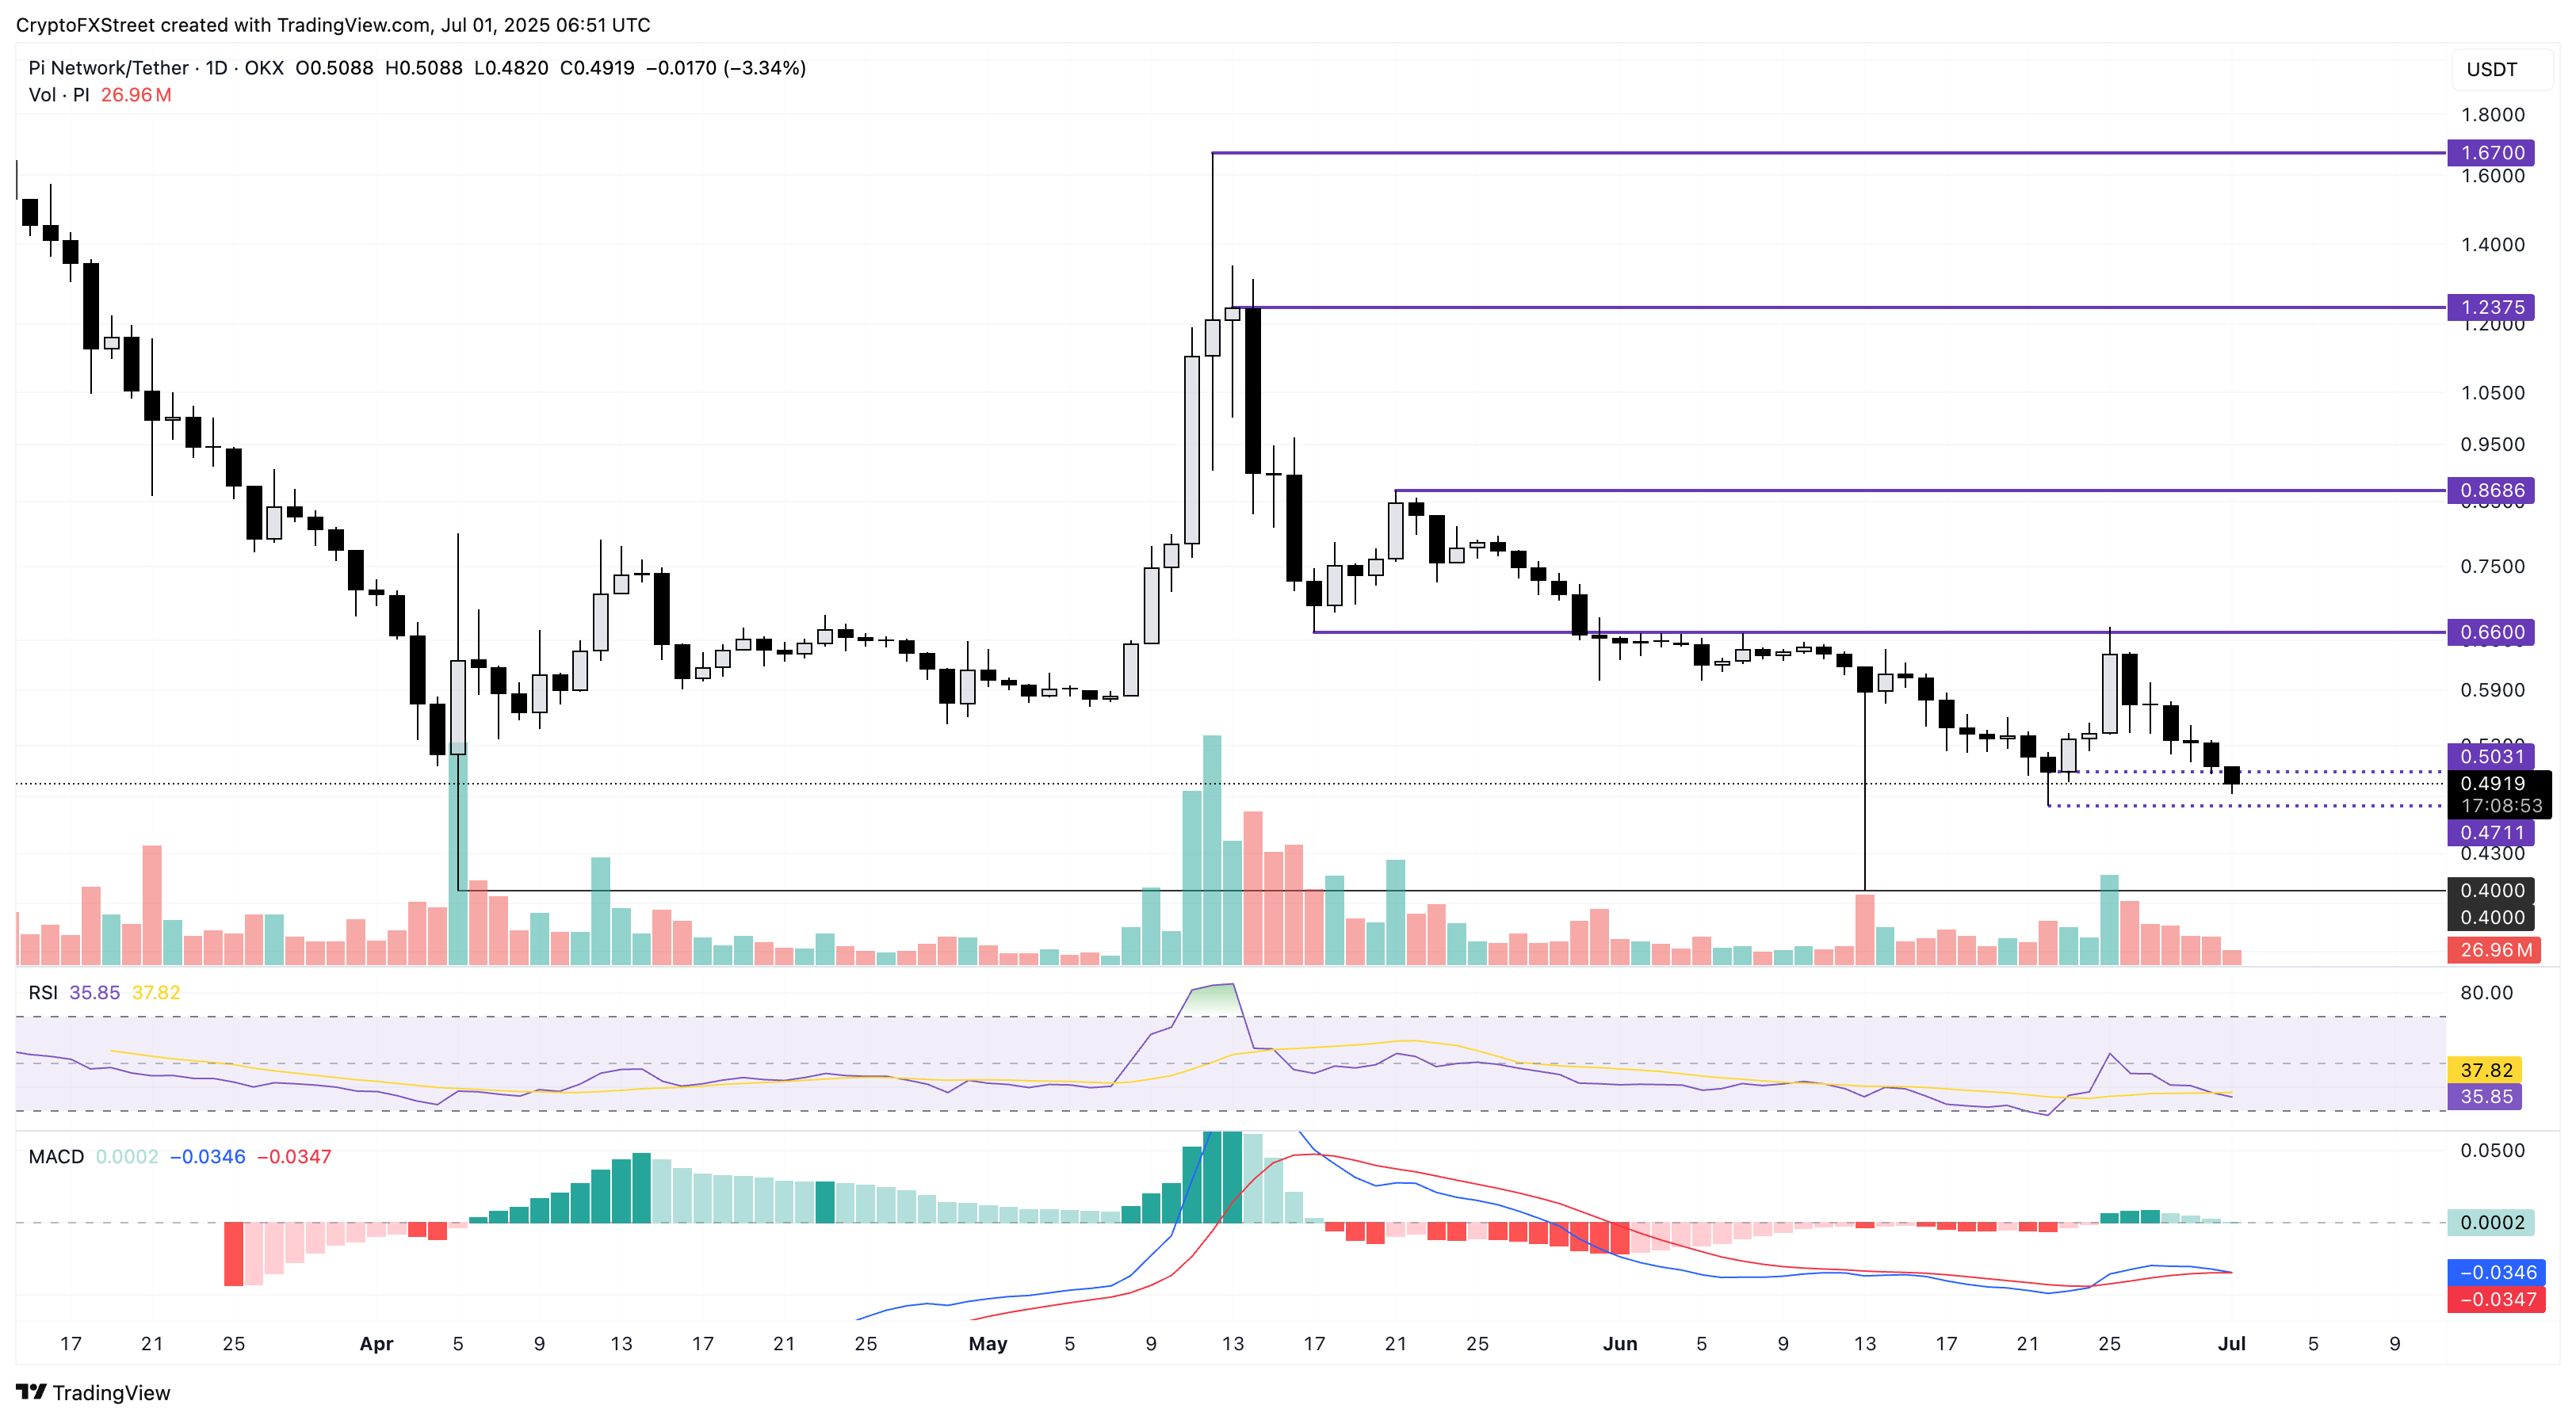
PI/USDT daily price chart.
Pi Network must avoid a close below the $0.5031 mark to signal a reversal possibility. In such a situation, with a lower shadow candle, PI could target the $0.6600 price level, which aligns with the low from May 17.
Bitcoin, altcoins, stablecoins FAQs
Bitcoin is the largest cryptocurrency by market capitalization, a virtual currency designed to serve as money. This form of payment cannot be controlled by any one person, group, or entity, which eliminates the need for third-party participation during financial transactions.
Altcoins are any cryptocurrency apart from Bitcoin, but some also regard Ethereum as a non-altcoin because it is from these two cryptocurrencies that forking happens. If this is true, then Litecoin is the first altcoin, forked from the Bitcoin protocol and, therefore, an “improved” version of it.
Stablecoins are cryptocurrencies designed to have a stable price, with their value backed by a reserve of the asset it represents. To achieve this, the value of any one stablecoin is pegged to a commodity or financial instrument, such as the US Dollar (USD), with its supply regulated by an algorithm or demand. The main goal of stablecoins is to provide an on/off-ramp for investors willing to trade and invest in cryptocurrencies. Stablecoins also allow investors to store value since cryptocurrencies, in general, are subject to volatility.
Bitcoin dominance is the ratio of Bitcoin's market capitalization to the total market capitalization of all cryptocurrencies combined. It provides a clear picture of Bitcoin’s interest among investors. A high BTC dominance typically happens before and during a bull run, in which investors resort to investing in relatively stable and high market capitalization cryptocurrency like Bitcoin. A drop in BTC dominance usually means that investors are moving their capital and/or profits to altcoins in a quest for higher returns, which usually triggers an explosion of altcoin rallies.
บทความแนะนำ


