


Pi Network Price Forecast: PI stalls as weak crypto sentiment caps recovery
- Pi Network hovers around $0.0760 on Tuesday after a roughly 2% rebound the previous day.
- Fear and Greed Index below 50 and declining crypto market trading volume suggest waning investor interest in crypto assets.
- The technical outlook for PI indicates a downside bias, with price capped and momentum remaining weak.
Pi Network (PI) holds steady above $0.0760 at press time on Tuesday, stalling after a roughly 2% rebound the previous day. The broader market's weak sentiment and reduced trading volume weigh on the PI token. The technical outlook is bearish, with price capped below a long-term resistance trendline and weak momentum.
Broader market weakness weighs on PI
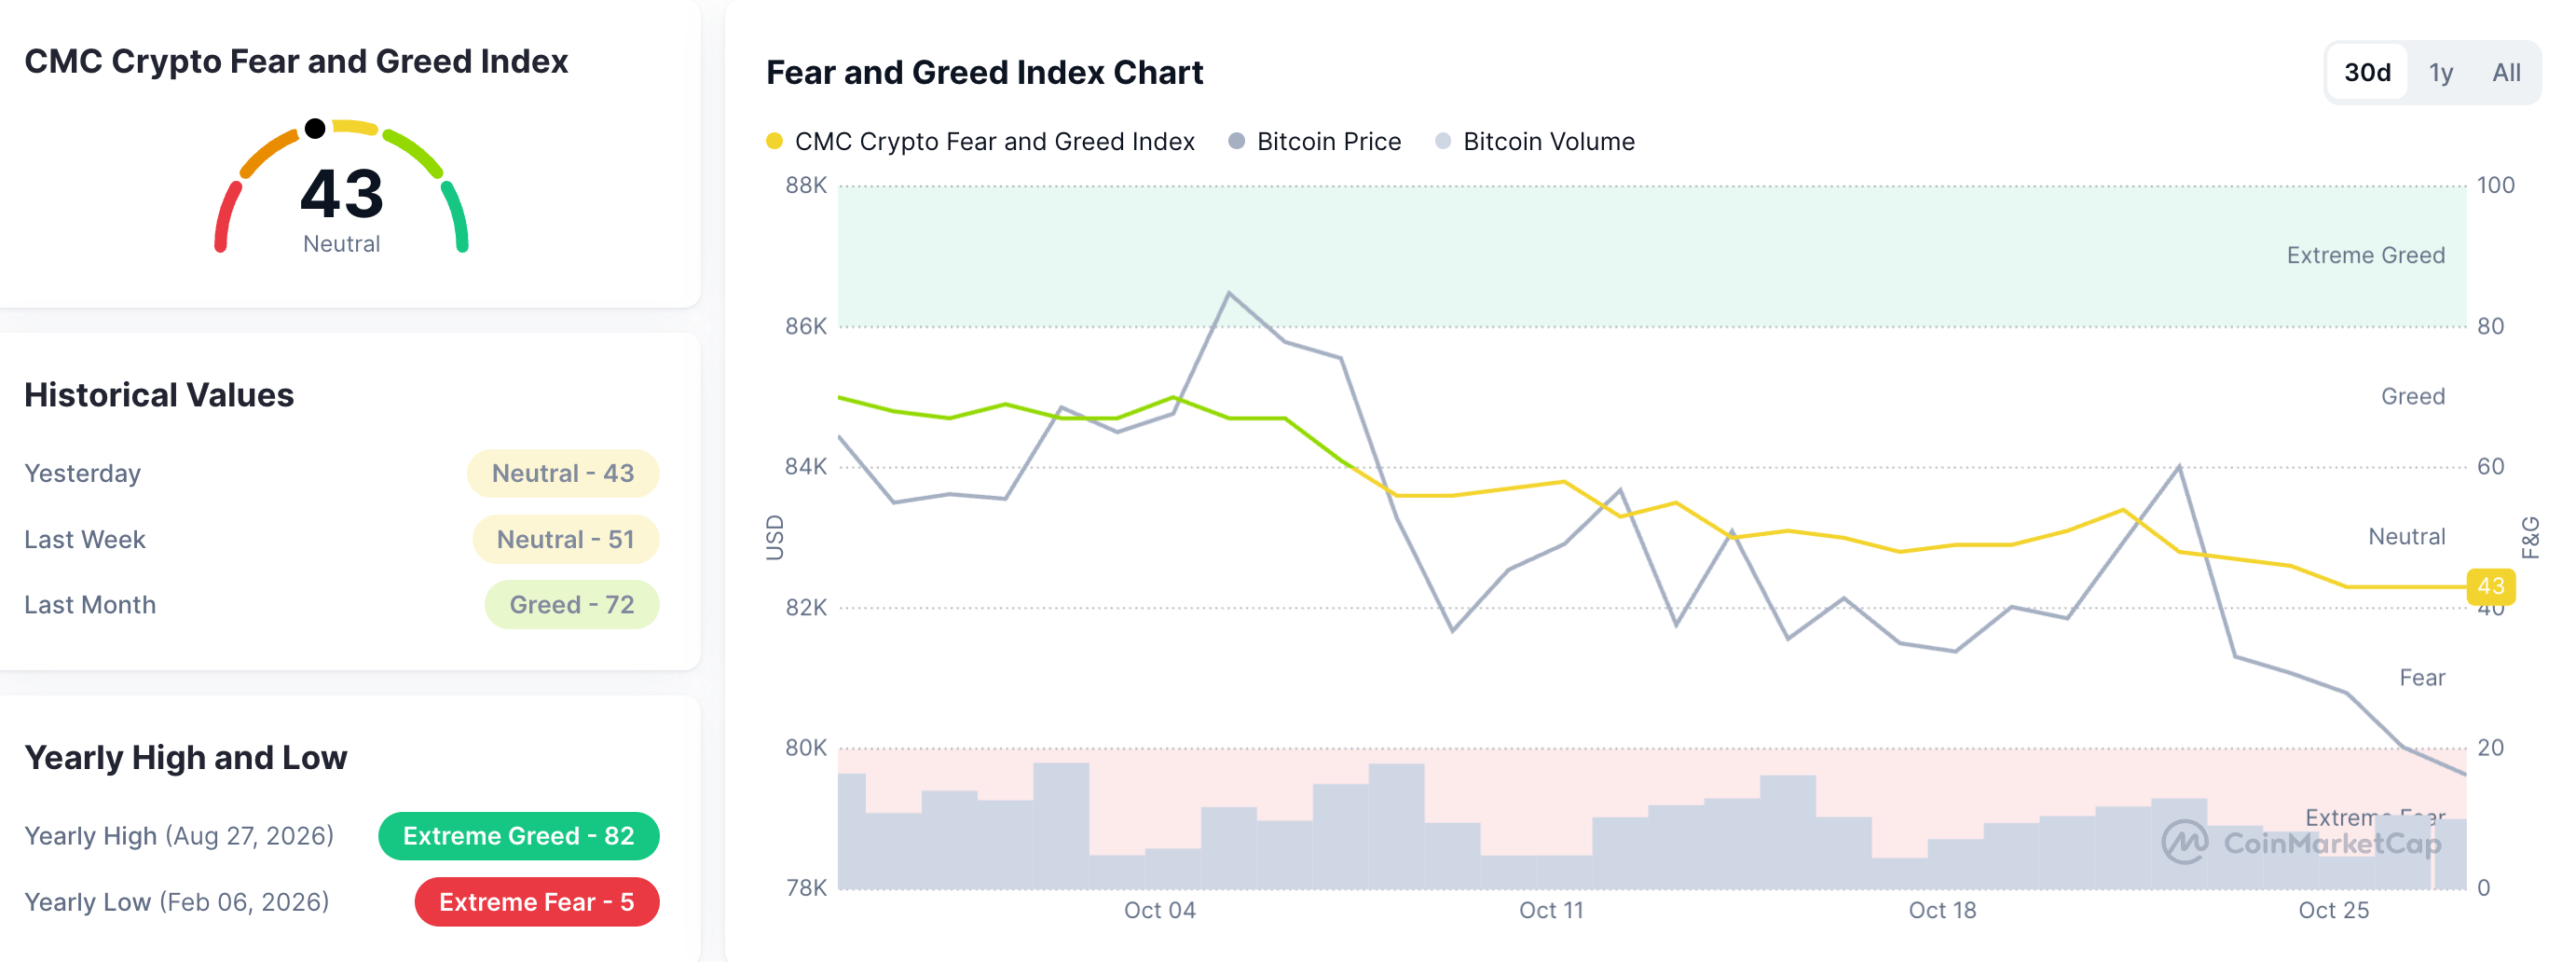
Investor interest in the broader cryptocurrency market is waning ahead of the volatile events, including US midterm elections on November 4 and the US Federal Reserve’s decision on interest rates on Wednesday. CoinMarketCap’s Fear and Greed Index is down 43 points on Tuesday, hovering near the lower end of the neutral zone, down from 51 last week.
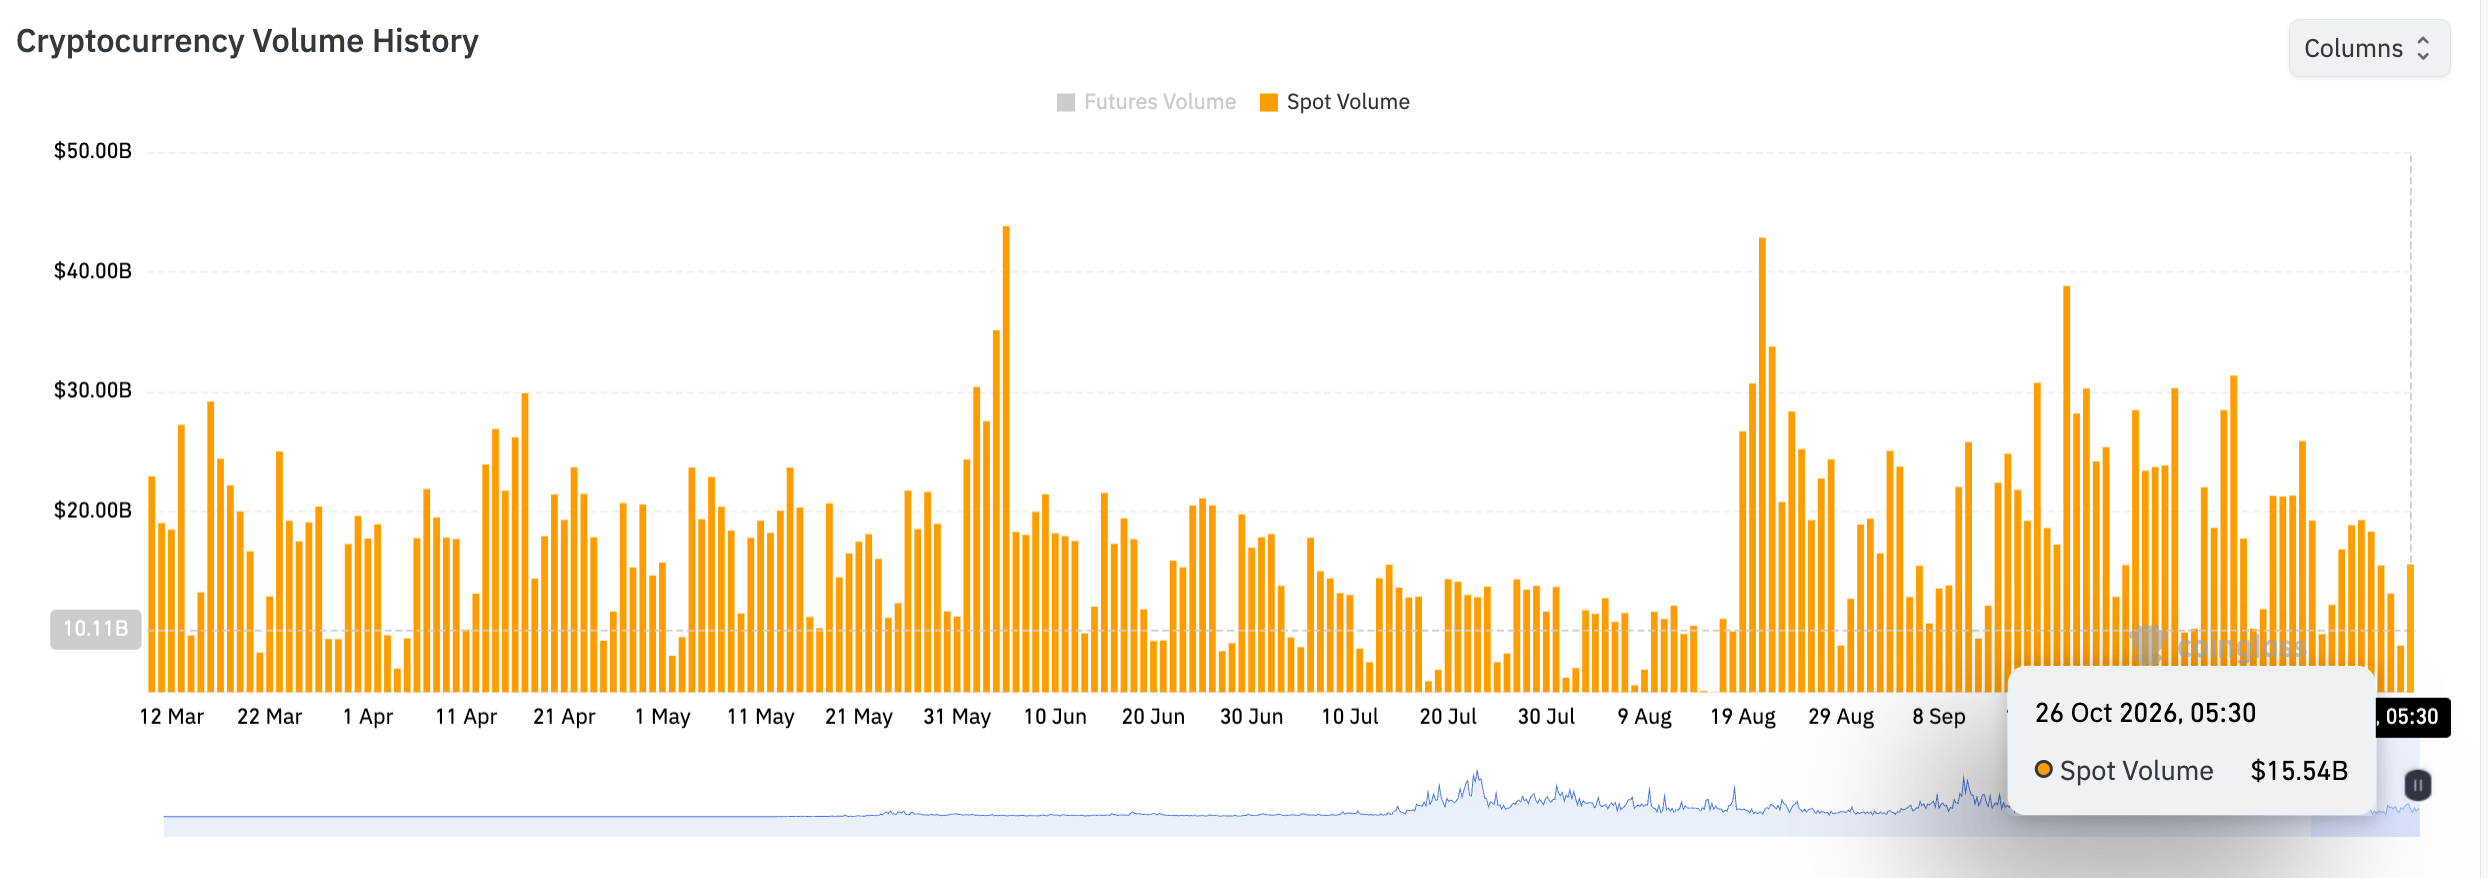
In addition, the crypto market’s daily spot trading volume shows a broadly declining trend. CoinGlass data shows $15.54 billion in daily trading volume recorded on Monday, up from $8.77 billion the previous day. However, the broader trend shows multiple lower highs since September 21, with a spot volume of $38.81 billion. This reaffirms the declining interest among traders amid uncertainties.
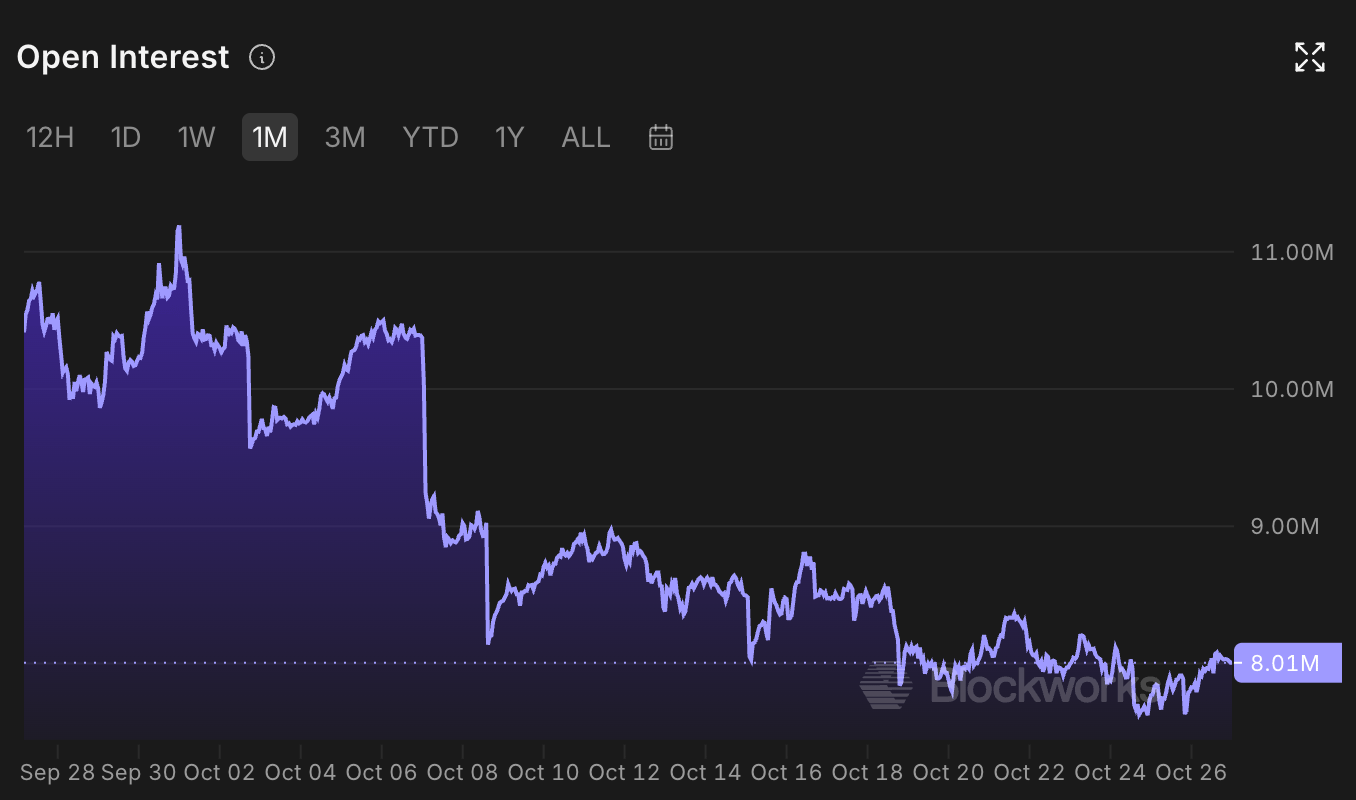
Pi Network faces a similar decline in its retail strength. CoinAnk data shows the PI futures Open Interest (OI) stands at $8.01 million on Tuesday, down from $8.36 million last week, indicating reduced notional value of active positions. Typically, a decline in OI refers to a reduction in the spot price or a positional wipeout.
Technical outlook: Can PI regain strength?
Pi Network trades at $0.0763 at press time on Tuesday, extending a bearish bias. The PI token holds beneath the 50- and 200-day Exponential Moving Averages (EMAs) at $0.0840 and $0.1163, respectively, and the downward resistance trendline at $0.0807, keeping recovery attempts capped.
Momentum remains fragile, with the Relative Strength Index (RSI) hovering around 36, close to oversold territory, while the Moving Average Convergence Divergence (MACD) line flattens just below the zero line, both of which hint at persistent selling pressure.
On the topside, initial resistance is observed at the former trendline around $0.0807, followed by the 50-day EMA at $0.0840 and the 23.6% Fibonacci retracement at $0.0866, measured from $0.1394 to $0.0704. Above that, a broader corrective hurdle is clustered around the 50% retracement at $0.1049 and the 200-day EMA near $0.1163.
On the downside, the only nearby structural support emerges at the Fibonacci anchor around $0.0704, where buyers could attempt to slow the current downtrend if the pair extends its slide.
(The technical analysis of this story was written with the help of an AI tool. Know more.)
บทความแนะนำ


