

Solana Price Forecast: SOL rally remains capped as ETF inflows ease

แหล่งที่มา Fxstreet
  • Solana hovers around $120 on Monday, ticking lower after four consecutive days of recovery.
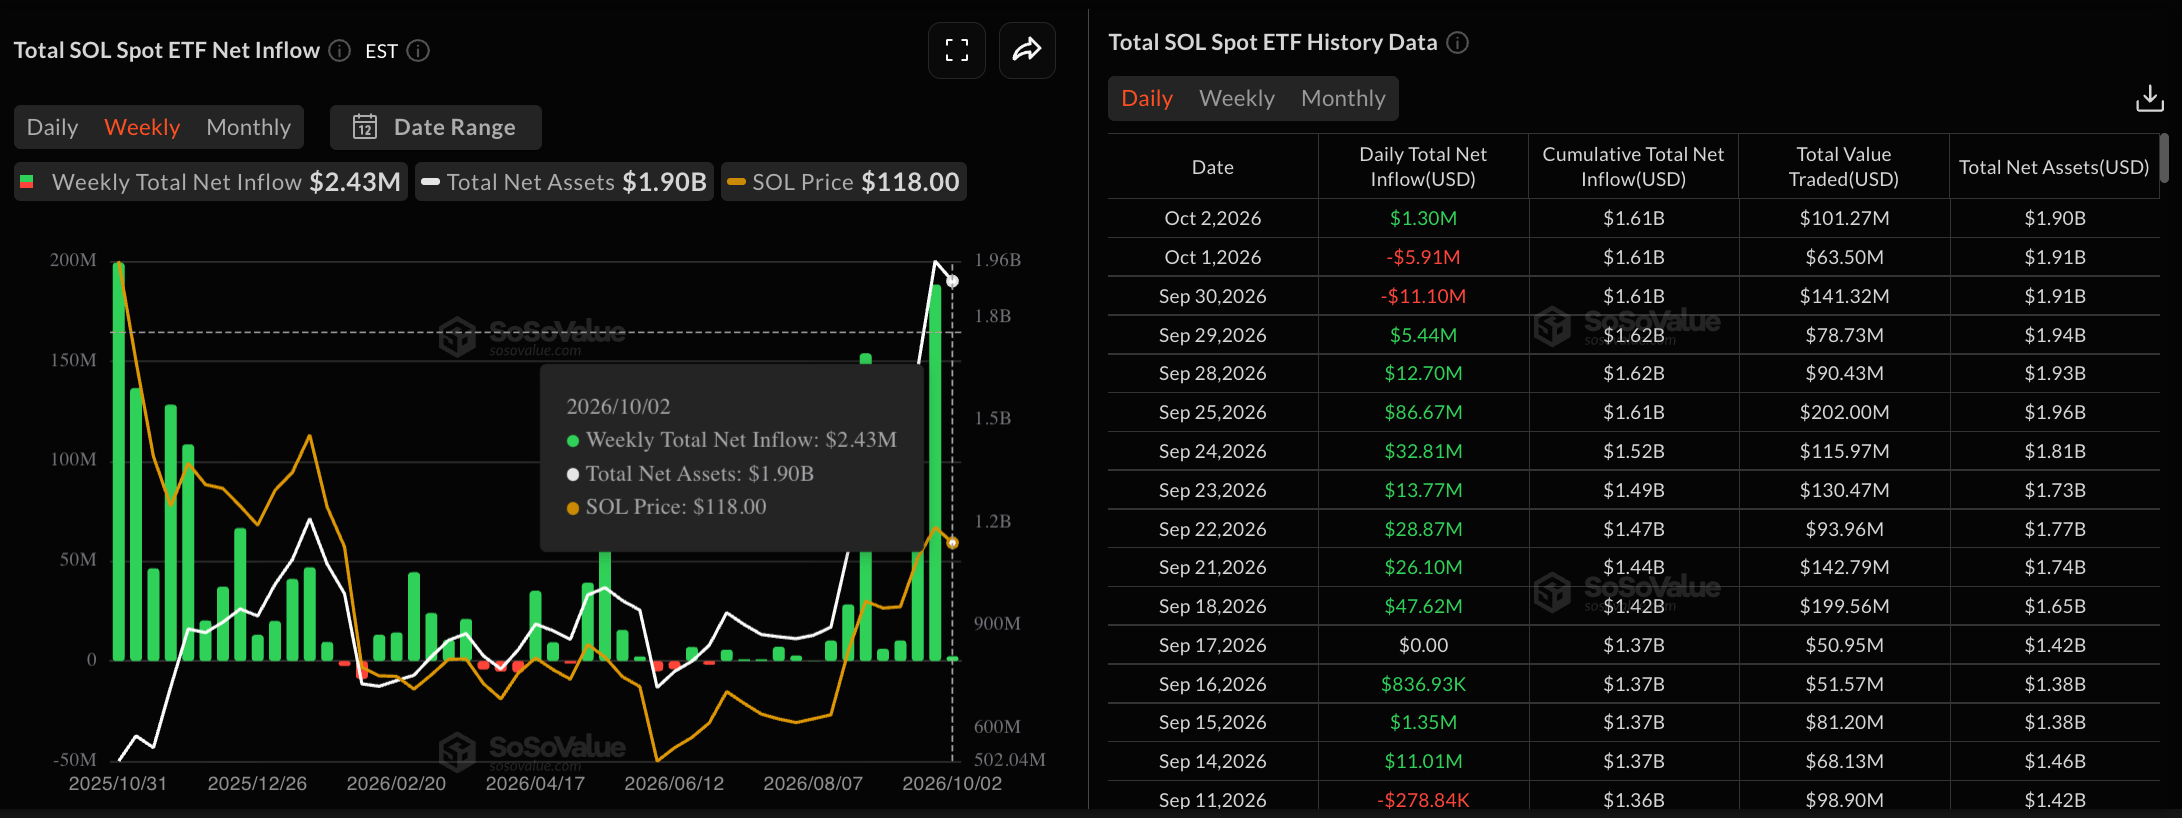
  • SOL-focused ETF inflows fell below $2.50 million last week, suggesting easing institutional demand.
  • The technical outlook for SOL remains mildly bullish, with a triangle pattern forming on the four-hour chart.

Solana (SOL) price edges lower on Monday, hovering around $120 after four consecutive days of trading in the green. The institutional support for SOL eased last week, with total inflows of less than $2.50 million, from over $188 million in the previous week. The technical outlook for SOL remains mildly bullish, forming a triangle pattern on the four-hour chart.

Mixed institutional support

Solana sees a steep decline in total weekly inflows from Exchange-Traded Funds (ETFs). SoSoValue data shows SOL-focused ETFs recorded $2.43 million in inflows last week, down from $188.22 million, marking its 14th consecutive positive week but significantly reduced institutional demand.
SOL ETFs data. Source: Sosovalue

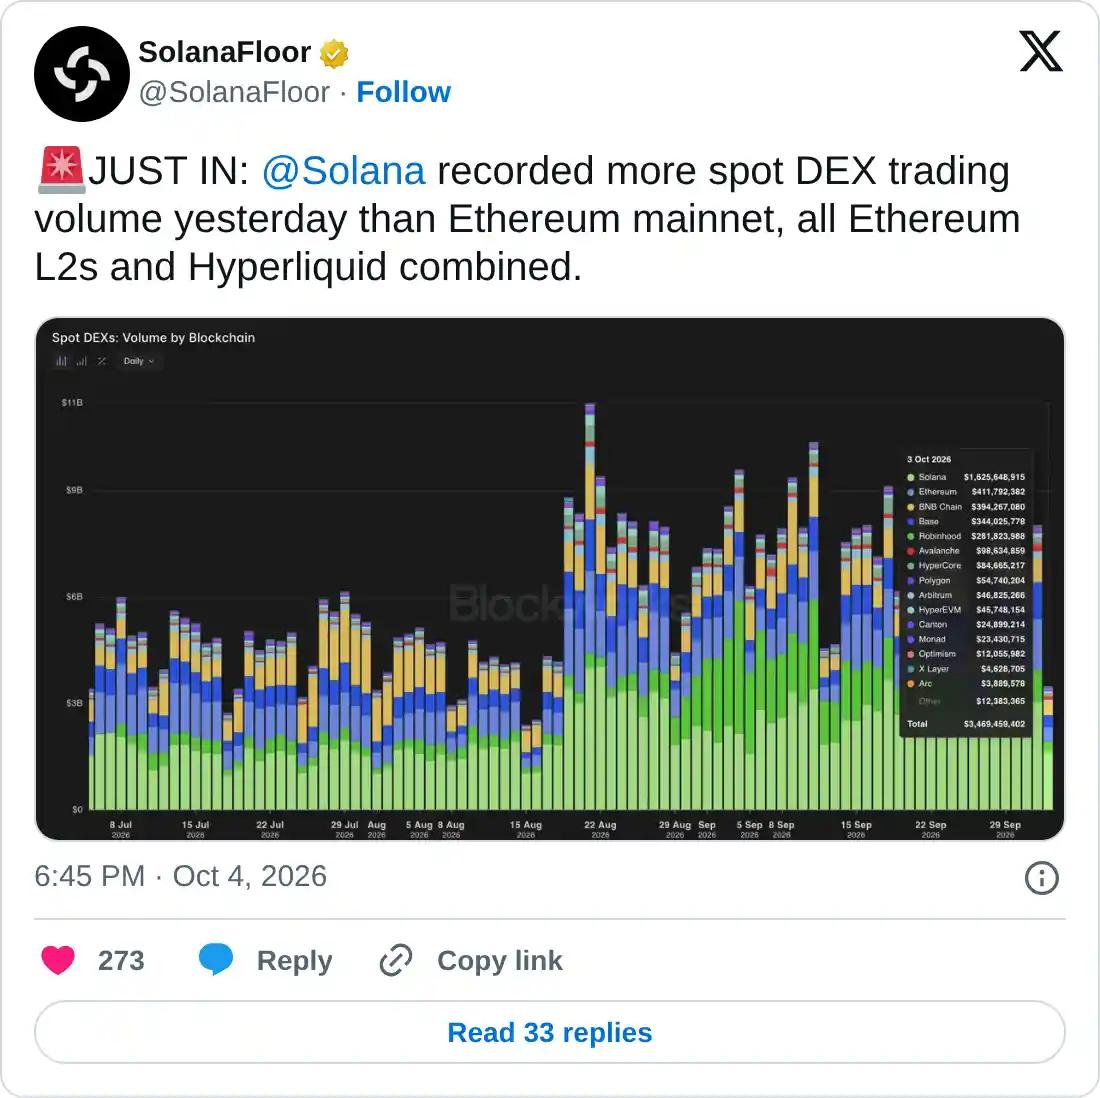
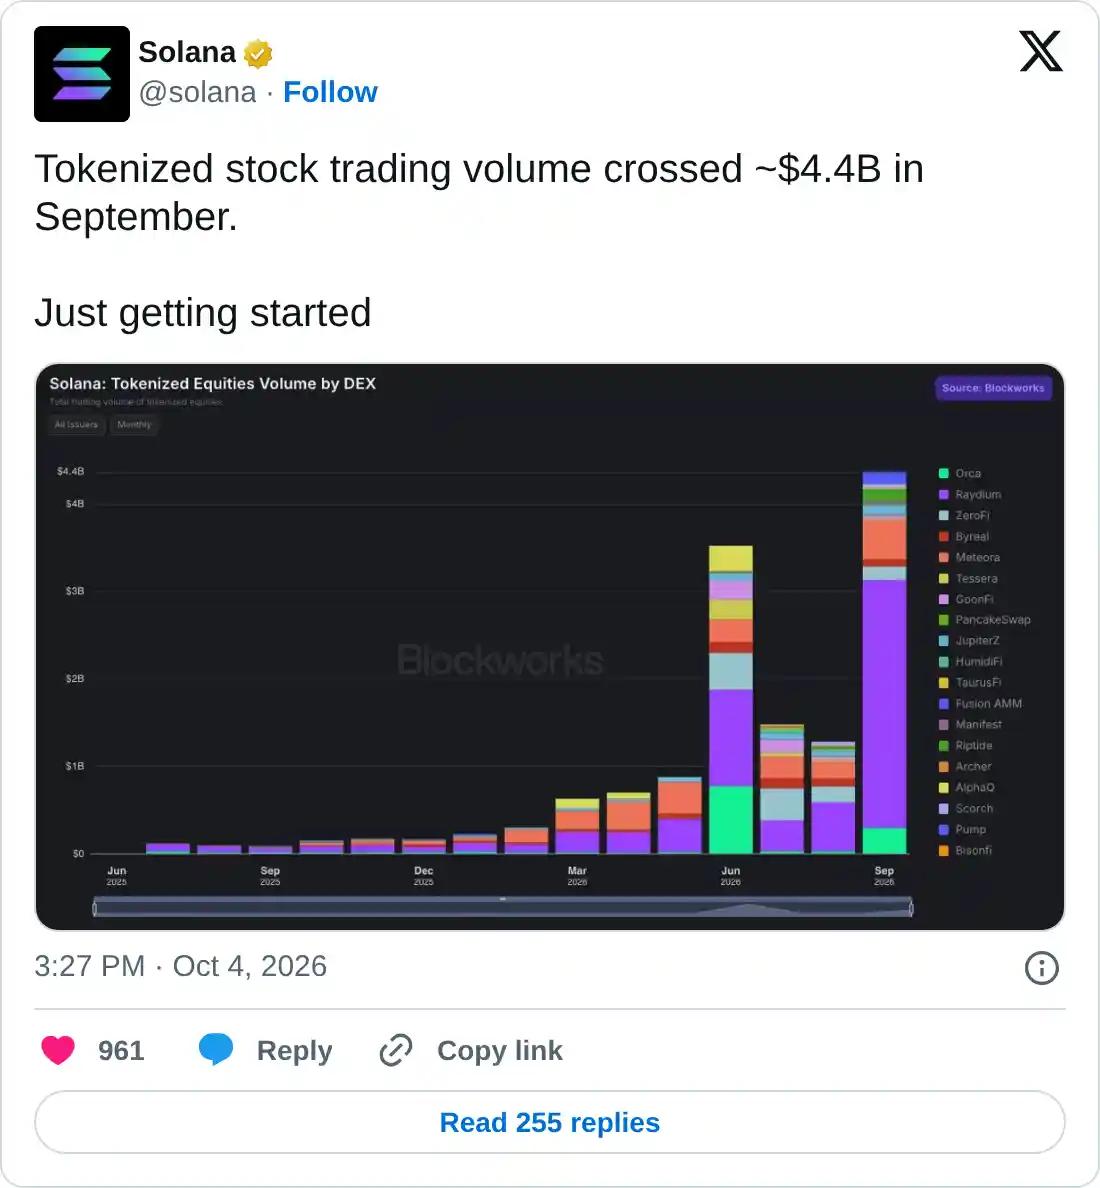
The Solana network shows steady growth despite easing institutional inflows. SolanaFloor data shows that Solana DEX trading volume on Sunday surpassed the combined volume of Ethereum mainnet, its Layer-2 protocols, and Hyperliquid. In addition, the Real-World Assets (RWAs) trading on Solana witnessed over $4.4 billion in volume from tokenized stocks. This suggests early signs of bringing traditional equities to the Solana ecosystem to bridge the gap between crypto and the broader capital markets.
https://x.com/SolanaFloor/status/2106817883032760546

https://x.com/solana/status/2106768200264241173

Technical outlook: Solana holds stable as bullish bias persists

Solana edges lower on Monday after a steady recovery seen over the last four days. SOL holds a constructive bullish bias as price remains above the 50-, 100-, and 200-period Exponential Moving Averages (EMAs) on the four-hour chart around $119.24, $116.43, and $110.44.

From a technical perspective, SOL is positioned well above the upward support trendline at $119.16, keeping the recent recovery phase intact, while an overhead near-term resistance trendline near $123 suggests a triangle pattern.

Momentum on the daily chart is constructive, with a mildly positive Moving Average Convergence Divergence (MACD) and a Relative Strength Index (RSI) near 54, suggesting bullish momentum.

A confirmed breakout of the resistance cluster formed by the trendline near $123 and September's high of $124.95 could further extend the Solana rally. The Fibonacci retracement measured from $95.82 to $124.95 projects the 127.2% extension level at $132.87 as the next bullish target.

Chart Analysis SOL/USDT (Binance)
SOL/USDT four-hour price chart.

On the downside, immediate support is seen at the 50-period EMA near $119.25, reinforced by the reclaimed rising trendline at $119.16 and the 78.6% Fibonacci retracement at $118.71. A break below these would expose deeper cushions at the 100-period EMA around $116.43.

(The technical analysis of this story was written with the help of an AI tool. Know more.)

ข้อจำกัดความรับผิดชอบ: เพื่อการอ้างอิงเท่านั้น ผลการดำเนินงานในอดีตไม่ได้บ่งบอกถึงผลลัพธ์ในอนาคต
placeholder
ดอลลาร์ออสเตรเลียอ่อนค่าลงใกล้ระดับ 0.7000 จากสัญญาณเชิงเข้มงวดของเฟด ขณะที่การตัดสินใจอัตราดอกเบี้ยของ RBA ใกล้เข้ามาคู่ AUDUSD สูญเสียแรงส่งลงมาใกล้ 0.7010 ในช่วงเช้าของตลาดลงทุนเอเชียวันจันทร์ ดอลลาร์สหรัฐ (USD) แข็งค่าขึ้นเมื่อเทียบกับดอลลาร์ออสเตรเลีย (AUD) จากอัตราผลตอบแทนพันธบัตรรัฐบาลสหรัฐฯ ที่เพิ่มขึ้นและการเก็งว่าธนาคารกลางสหรัฐฯ (Fed) จะปรับขึ้นอัตราดอกเบี้ยเพิ่มเติม开奖现场直播
ผู้เขียน  FXStreet
9 เดือน 28 วัน จันทร์
คู่ AUDUSD สูญเสียแรงส่งลงมาใกล้ 0.7010 ในช่วงเช้าของตลาดลงทุนเอเชียวันจันทร์ ดอลลาร์สหรัฐ (USD) แข็งค่าขึ้นเมื่อเทียบกับดอลลาร์ออสเตรเลีย (AUD) จากอัตราผลตอบแทนพันธบัตรรัฐบาลสหรัฐฯ ที่เพิ่มขึ้นและการเก็งว่าธนาคารกลางสหรัฐฯ (Fed) จะปรับขึ้นอัตราดอกเบี้ยเพิ่มเติม开奖现场直播
placeholder
ข่าวหุ้นวันนี้ ทรัมป์ปัดดีลอิหร่านดันน้ำมันพุ่ง ดอลลาร์-บอนด์ยีลด์ ทุบหุ้น-ทองร่วงหนัก SET ลุ้นศาล รธน. บ่ายนี้ทันทุกกระแสการเงิน สรุปข่าวเด่น Forex หุ้น ทองคำ คริปโตฯ และเศรษฐกิจรอบวัน วิเคราะห์แนวโน้มตลาดด้วยข้อมูลเชิงลึก อ่านง่าย เข้าใจไว อัปเดตล่าสุดที่นี่
ผู้เขียน  Mitrade
9 เดือน 28 วัน จันทร์
ทันทุกกระแสการเงิน สรุปข่าวเด่น Forex หุ้น ทองคำ คริปโตฯ และเศรษฐกิจรอบวัน วิเคราะห์แนวโน้มตลาดด้วยข้อมูลเชิงลึก อ่านง่าย เข้าใจไว อัปเดตล่าสุดที่นี่
placeholder
ทองคำดีดตัวจากระดับ 4,110 ดอลลาร์ ขณะที่การร่วงลงของราคาน้ำมันช่วยคลายแรงกดดันด้านเงินเฟ้อราคาทองคำ (XAU/USD) ปรับตัวเพิ่มขึ้นอย่างแข็งแกร่งกว่า 1.30% ในวันอังคาร แม้เจ้าหน้าที่ธนาคารกลางสหรัฐฯ (เฟด) จะแสดงความเห็นไปในทาง hawkish หลังแตะระดับต่ำสุดในรอบหลายสัปดาห์ใกล้ $4,110 เมื่อวันจันทร์ คู่ XAU/USD ซื้อขายอยู่ที่ $4,170 หลังดีดตัวขึ้นจากระดับต่ำสุดรายวันที่ $4,113.
ผู้เขียน  FXStreet
9 เดือน 30 วัน พุธ
ราคาทองคำ (XAU/USD) ปรับตัวเพิ่มขึ้นอย่างแข็งแกร่งกว่า 1.30% ในวันอังคาร แม้เจ้าหน้าที่ธนาคารกลางสหรัฐฯ (เฟด) จะแสดงความเห็นไปในทาง hawkish หลังแตะระดับต่ำสุดในรอบหลายสัปดาห์ใกล้ $4,110 เมื่อวันจันทร์ คู่ XAU/USD ซื้อขายอยู่ที่ $4,170 หลังดีดตัวขึ้นจากระดับต่ำสุดรายวันที่ $4,113.
placeholder
พรีวิวตัวเลขการจ้างงานนอกภาคเกษตรสหรัฐฯ เดือนกันยายน: การเติบโตของการจ้างงานอาจชะลอตัวลง หุ้นสหรัฐฯ ดอลลาร์ และทองคำจะตอบสนองอย่างไร?ในวันศุกร์ที่ 2 ตุลาคม (EDT) สหรัฐฯ จะเปิดเผยรายงานการจ้างงานนอกภาคเกษตรประจำเดือนกันยายน โดยตลาดมุ่งเน้นไปที่ว่าการเติบโตของการจ้างงานจะสามารถรักษาการฟื้นตัวของเดือนสิงหาคมไว้ได้หรือไม่
ผู้เขียน  TradingKey
10 เดือน 01 วัน พฤหัส
ในวันศุกร์ที่ 2 ตุลาคม (EDT) สหรัฐฯ จะเปิดเผยรายงานการจ้างงานนอกภาคเกษตรประจำเดือนกันยายน โดยตลาดมุ่งเน้นไปที่ว่าการเติบโตของการจ้างงานจะสามารถรักษาการฟื้นตัวของเดือนสิงหาคมไว้ได้หรือไม่
placeholder
ความผันผวนของ Bitcoin (BTCUSD) เพิ่มสูงขึ้นในวันที่ 5 ต.ค.: สิ่งที่คุณควรรู้Bitcoin (BTCUSD) ปรับขึ้น 1.08% ณ วันที่ 5 ต.ค. เวลา 21:15(ET) อยู่ที่ $86721.22 โดยมีการเคลื่อนไหวในช่วง 7 วันที่ผ่านมา ปรับขึ้น 3.84%อะไรเป็นแรงผลักดันให้ราคาหุ้น Bitcoin (BTCUSD) ปรับตัว ขึ้น ในวัน
ผู้เขียน  TradingKey
21 ชั่วโมงที่แล้ว
Bitcoin (BTCUSD) ปรับขึ้น 1.08% ณ วันที่ 5 ต.ค. เวลา 21:15(ET) อยู่ที่ $86721.22 โดยมีการเคลื่อนไหวในช่วง 7 วันที่ผ่านมา ปรับขึ้น 3.84%อะไรเป็นแรงผลักดันให้ราคาหุ้น Bitcoin (BTCUSD) ปรับตัว ขึ้น ในวัน
ตราสารที่เกี่ยวข้อง
goTop
quote