


Top 3 Price Prediction: Bitcoin, Ethereum, Ripple – BTC, ETH and XRP retreat as Fed rate decision looms
- Bitcoin trades around $73,000 on Wednesday after dropping 3.25% the previous day.
- Ethereum fails to close above key resistance and slips below $2,300.
- XRP nears key EMA support zone following a correction over 9% on Tuesday.
Bitcoin (BTC), Ethereum (ETH) and Ripple (XRP) remain under pressure and consolidate at the time of writing on Wednesday after falling more than 3%, 4% and 9%, respectively, as the Clarity Act failed to advance in the Senate on Tuesday.
Market participants now await the Federal Reserve’s (Fed) interest rate decision and forward guidance by Fed Chairman Kevin Warsh on Wednesday, which could shape the near-term outlook for these top three cryptocurrencies.
Bitcoin remains above key EMAs
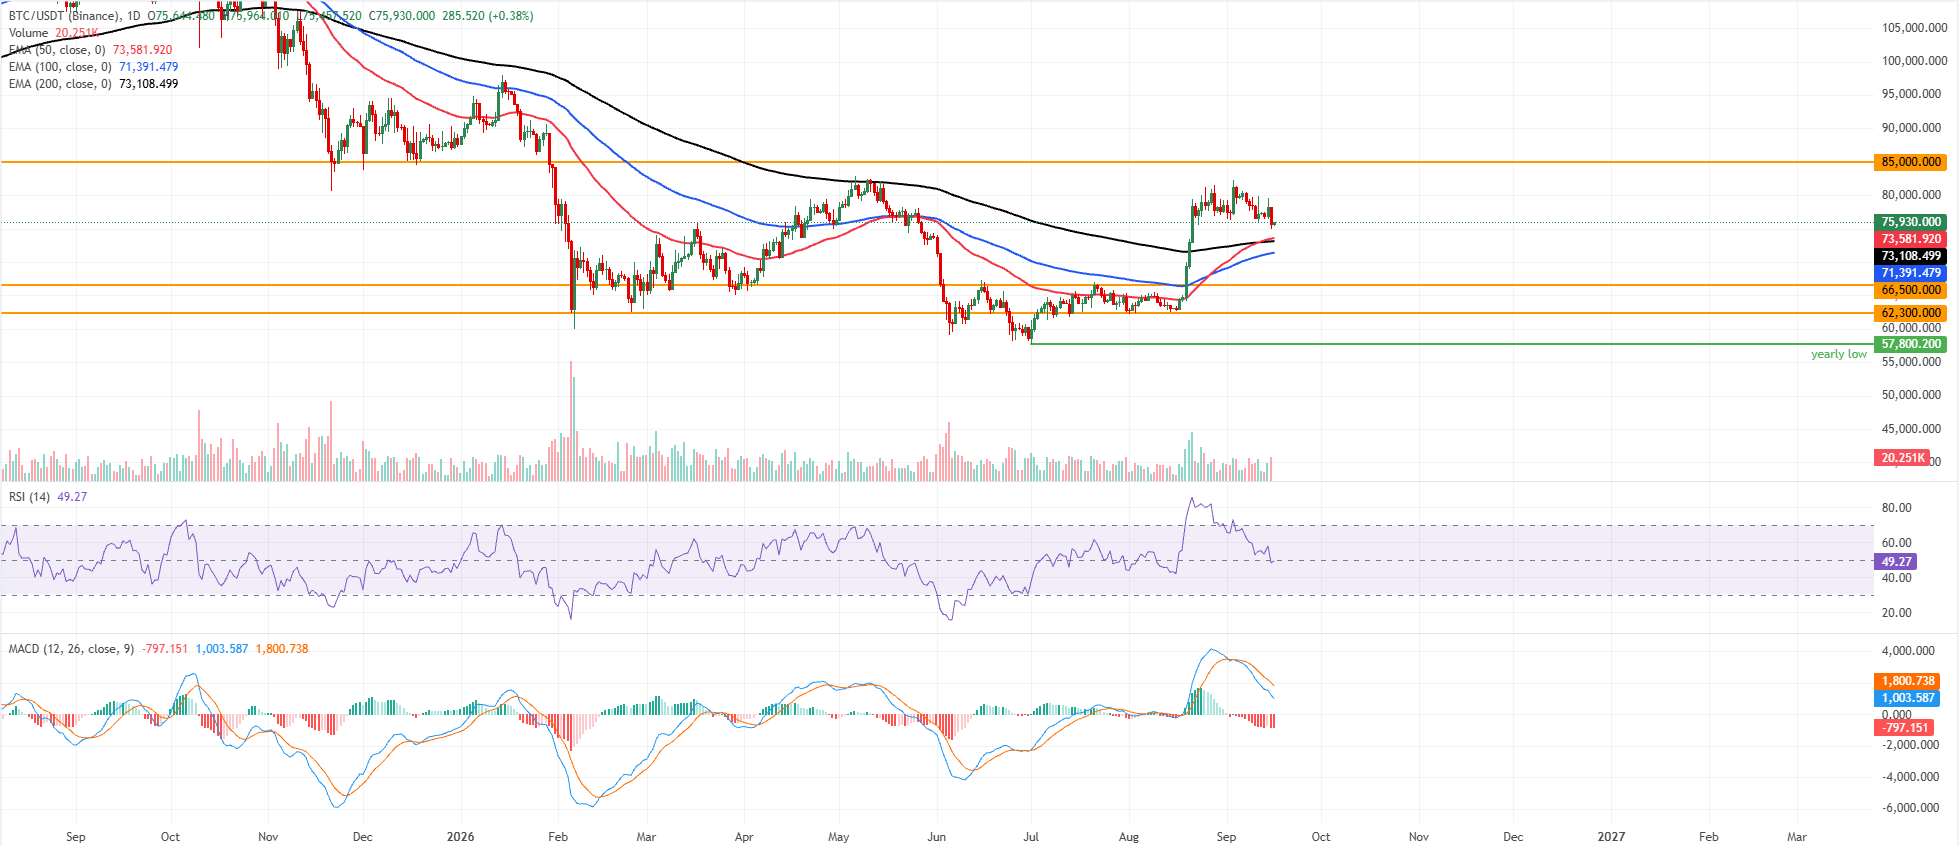
Bitcoin price trades at $75,930 on Wednesday after correcting over 3% the previous day. Despite the pullback, BTC holds a constructive bullish bias as price remains comfortably above the 50-day, 100-day and 200-day Exponential Moving Averages (EMAs), clustered between roughly $71,400 and $73,600.
This stacked EMA configuration hints at an underlying uptrend despite the recent pullback in momentum, with the Relative Strength Index (RSI) easing to around 49. At the same time, the Moving Average Convergence Divergence (MACD) stays negative and below the zero line, suggesting bullish structure remains intact but short-term upside is losing traction.
On the downside, immediate support is reinforced by the 50-day EMA at $73,581, followed by the 200-day EMA at $73,108 and the 100-day EMA at $71,391, ahead of more distant horizontal floors at $66,500 and $62,300.
On the topside, the next significant resistance is seen at the horizontal barrier near $85,000, where fresh supply could emerge if buyers extend the recovery from the current EMA-supported zone.
Ethereum’s momentum shows cooling signs
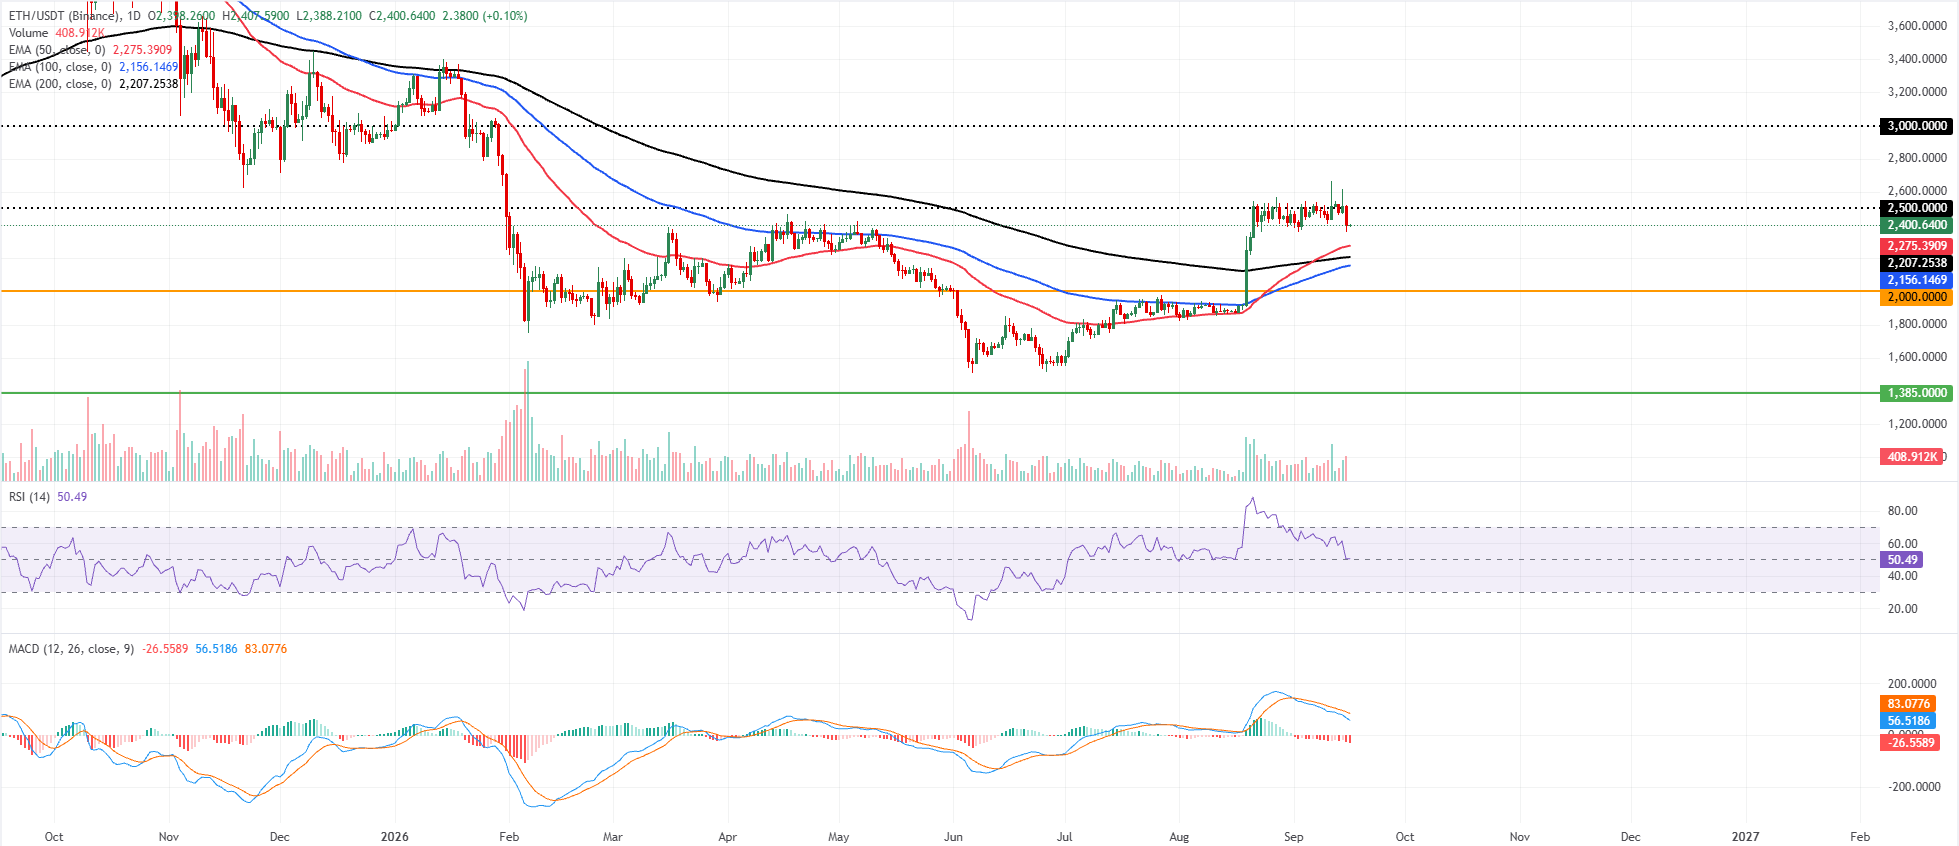
Ethereum price trades at $2,400 on Wednesday after dropping over 4% the previous day. ETH is holding above its key EMAs and retaining a broadly constructive bias despite recent consolidation.
ETH sits above the 50-day EMA near $2,275, with the 100-day EMA around $2,156 and the 200-day EMA near $2,207 reinforcing underlying demand. However, momentum has cooled, as the Relative Strength Index sits near a neutral 50 and the Moving Average Convergence Divergence (MACD) remains negative with a subdued histogram, suggesting bulls are advancing with less strength after the earlier overbought phase.
On the topside, initial resistance appears at the horizontal barrier around $2,500, ahead of a more substantial cap near $3,000.
On the downside, immediate support comes from the 50-day EMA at roughly $2,275, followed by the 200-day EMA near $2,207 and the 100-day EMA around $2,156. Below these dynamic supports, a more distant horizontal floor emerges at $2,000, with a deeper structural base near $1,385, levels that would likely come into focus only if current bullish footing erodes.
XRP shows cautiously bearish tone
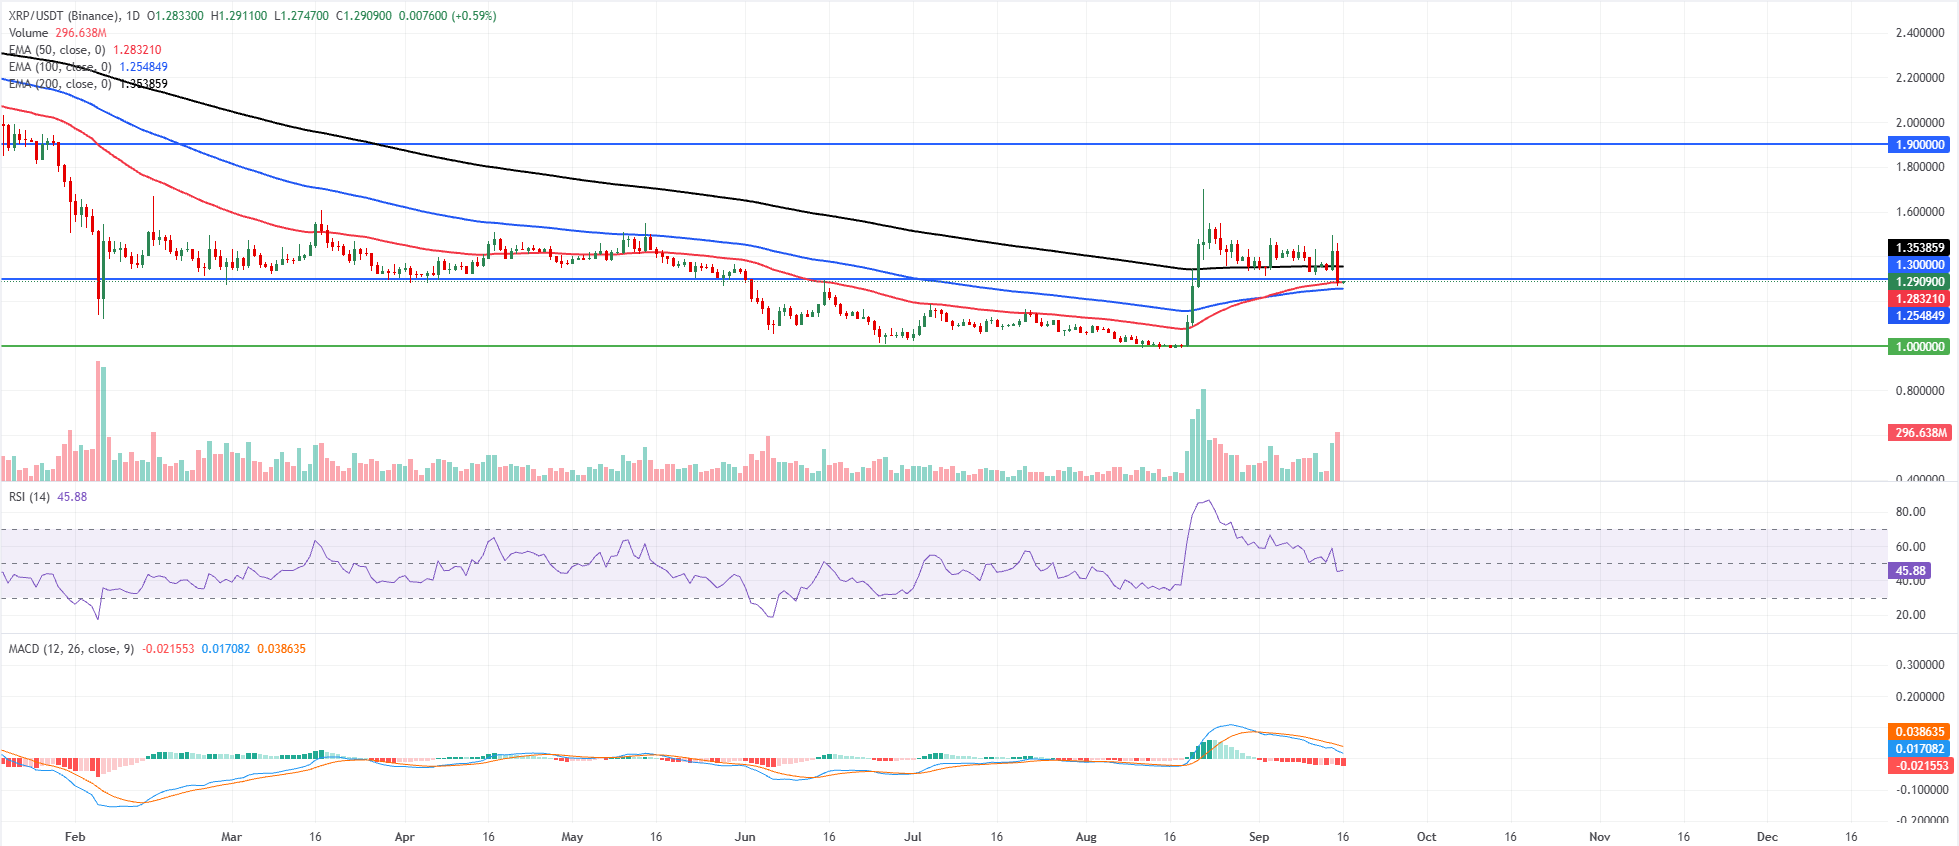
XRP price trades at $1.290 and has slipped back below the short-term recovery peak; on Wednesday, it trades above the 50-day and 100-day EMAs at $1.283 and $1.254, but remains capped well below the 200-day EMA at $1.353, keeping the broader tone cautiously bearish.
The RSI hovers just below the 50 line near 46, while the MACD stays in negative territory, together hinting that upside momentum is fading even as price holds slightly above its near-term EMA support band.
On the topside, initial resistance aligns with the nearby horizontal barrier at $1.300, ahead of the more significant 200-day EMA at $1.353; a sustained break above this latter level would be needed to ease the prevailing downside bias and open the way toward the higher resistance zone around $1.900.
On the downside, immediate support comes from the 50-day EMA at $1.283, reinforced by the 100-day EMA at $1.254 below; a daily close under this EMA cluster would expose the psychological and structural floor near $1.000, where buyers previously emerged.
(The technical analysis of this story was written with the help of an AI tool. Know more.)
Cryptocurrency prices FAQs
Token launches influence demand and adoption among market participants. Listings on crypto exchanges deepen the liquidity for an asset and add new participants to an asset’s network. This is typically bullish for a digital asset.
A hack is an event in which an attacker captures a large volume of the asset from a DeFi bridge or hot wallet of an exchange or any other crypto platform via exploits, bugs or other methods. The exploiter then transfers these tokens out of the exchange platforms to ultimately sell or swap the assets for other cryptocurrencies or stablecoins. Such events often involve an en masse panic triggering a sell-off in the affected assets.
Macroeconomic events like the US Federal Reserve’s decision on interest rates influence crypto assets mainly through the direct impact they have on the US Dollar. An increase in interest rate typically negatively influences Bitcoin and altcoin prices, and vice versa. If the US Dollar index declines, risk assets and associated leverage for trading gets cheaper, in turn driving crypto prices higher.
Halvings are typically considered bullish events as they slash the block reward in half for miners, constricting the supply of the asset. At consistent demand if the supply reduces, the asset’s price climbs.
บทความแนะนำ


