
Crypto Today: Bitcoin, Ethereum, XRP decline as risk-off sentiment escalates
- Bitcoin trades under pressure, testing $87,000 support amid persistent ETF outflows.
- Ethereum slides below $3,000 as intensifying headwinds mount, despite a resurgence in ETF inflows.
- XRP edges lower with a deteriorating technical structure, weighed down by a declining futures Open Interest.
Bitcoin (BTC) remains under pressure, trading above the $87,000 support at the time of writing on Tuesday. Selling pressure has continued to weigh on the broader cryptocurrency market since Monday, triggering declines across altcoins, including Ethereum (ETH) and Ripple (XRP).
The largest smart contracts token, ETH, is trading below $3,000 but holds above $2,900, while XRP holds above Friday’s support at $1.77, with its upside capped at under $2.00.
Data spotlight: Ethereum and XRP see ETF inflows amid persistent BTC outflows
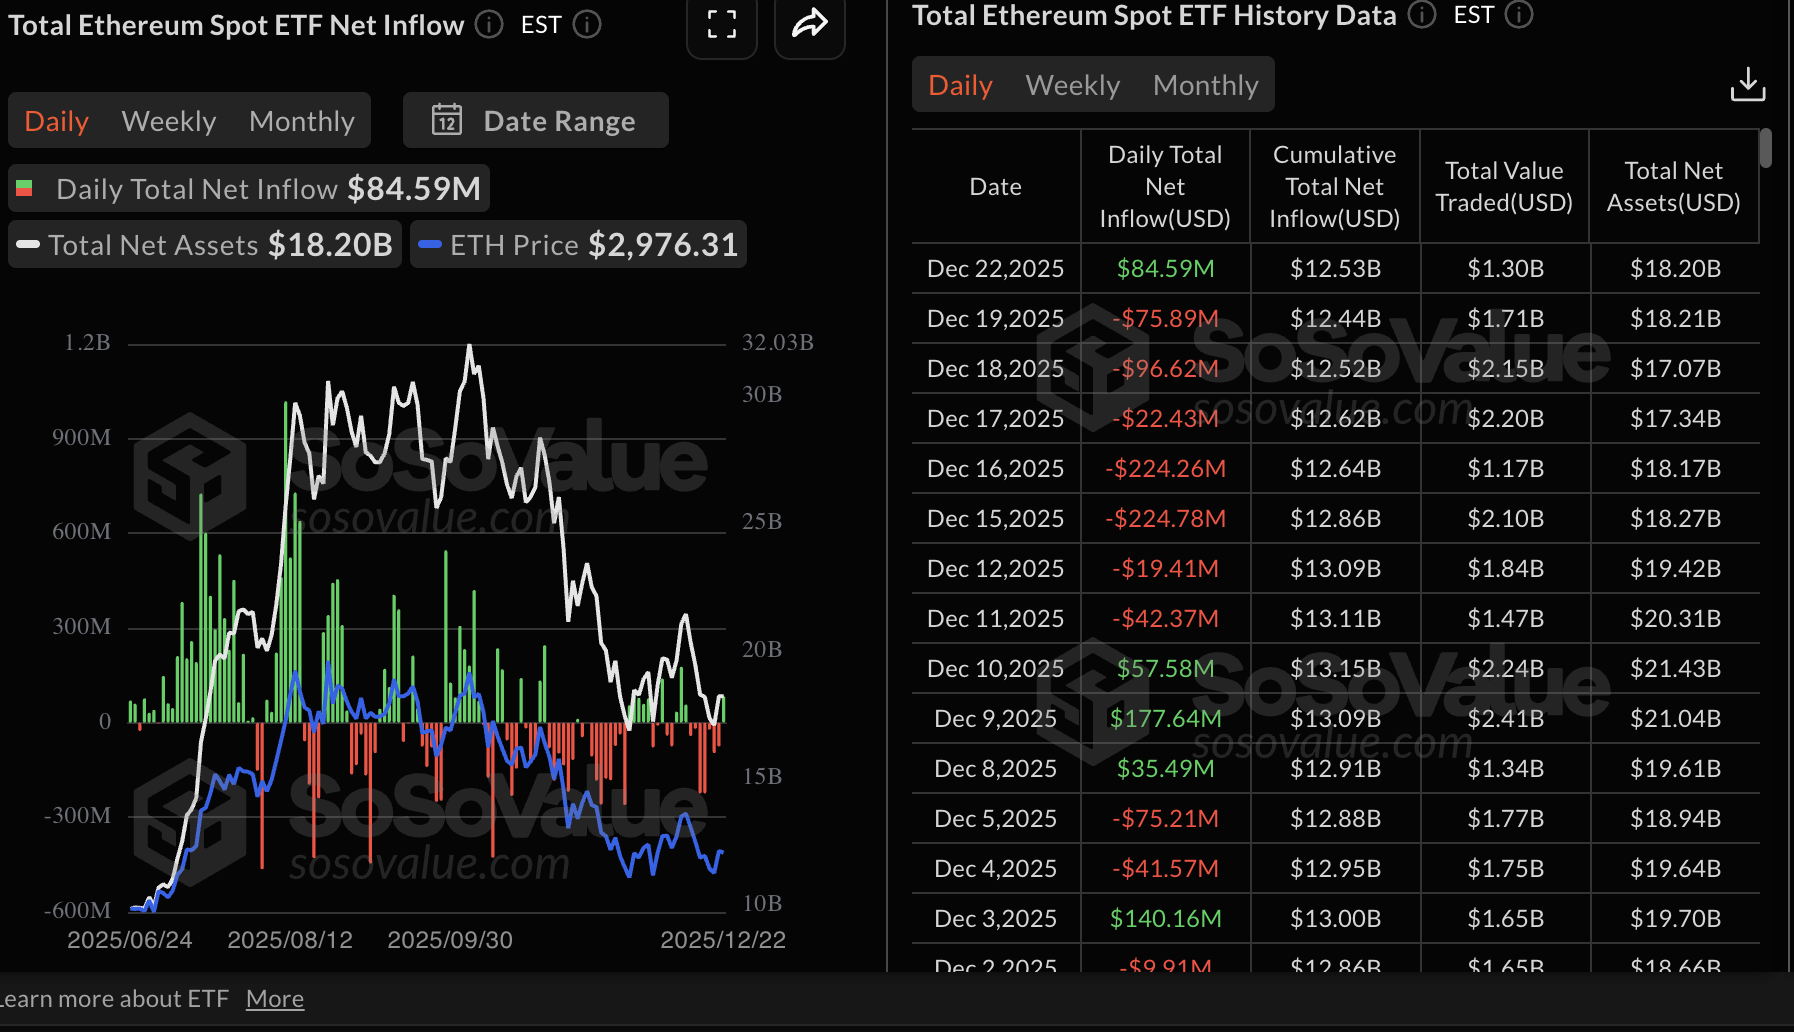
Ethereum spot Exchange Traded Funds (ETFs) broke a seven-day outflow streak, with inflows amounting to nearly $85 million on Monday.
The resurgence of inflows occurred despite risk-off sentiment across the cryptocurrency market, suggesting a potential turnaround for institutional investors. The cumulative net inflow now stands at $12.53 billion, with net assets at $18.20 billion.
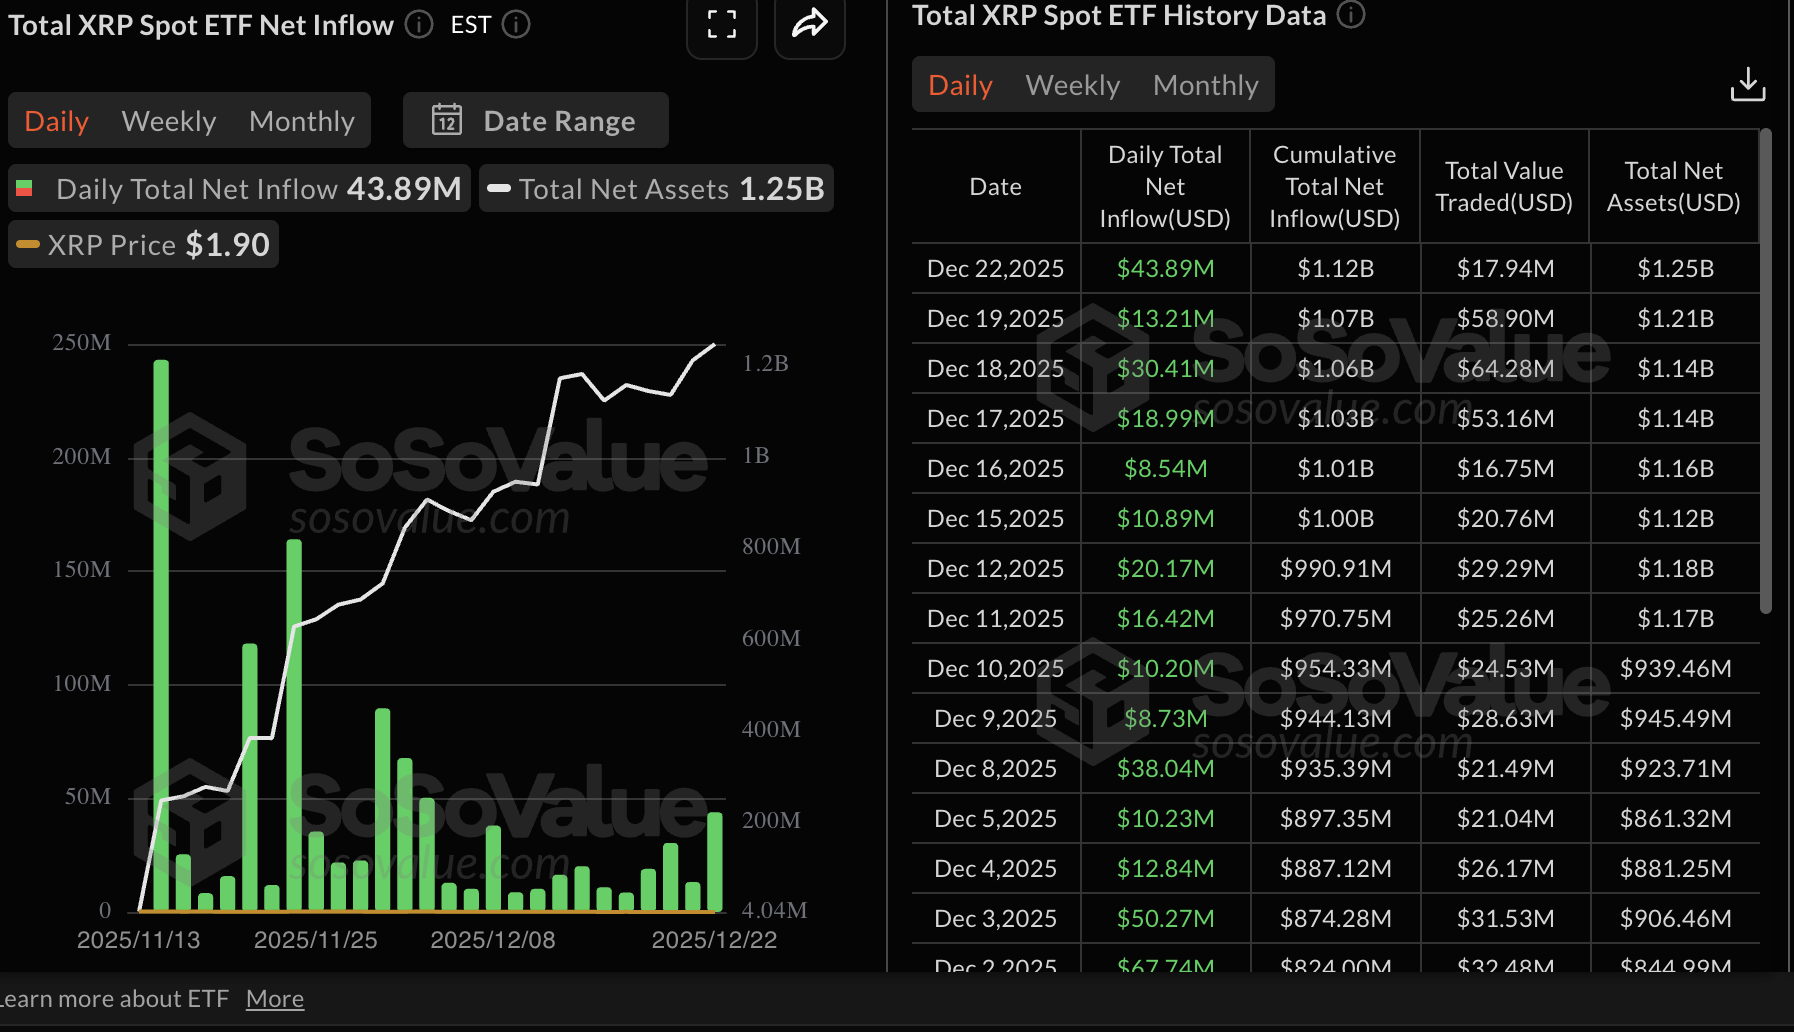
XRP spot ETFs, on the other hand, extended their steady ETF inflow streak, drawing almost $44 million on Monday. Since their debut in mid-November, XRP ETFs have not experienced outflows. The cumulative net inflow stands at $1.12 billion with net assets of $1.25 billion.
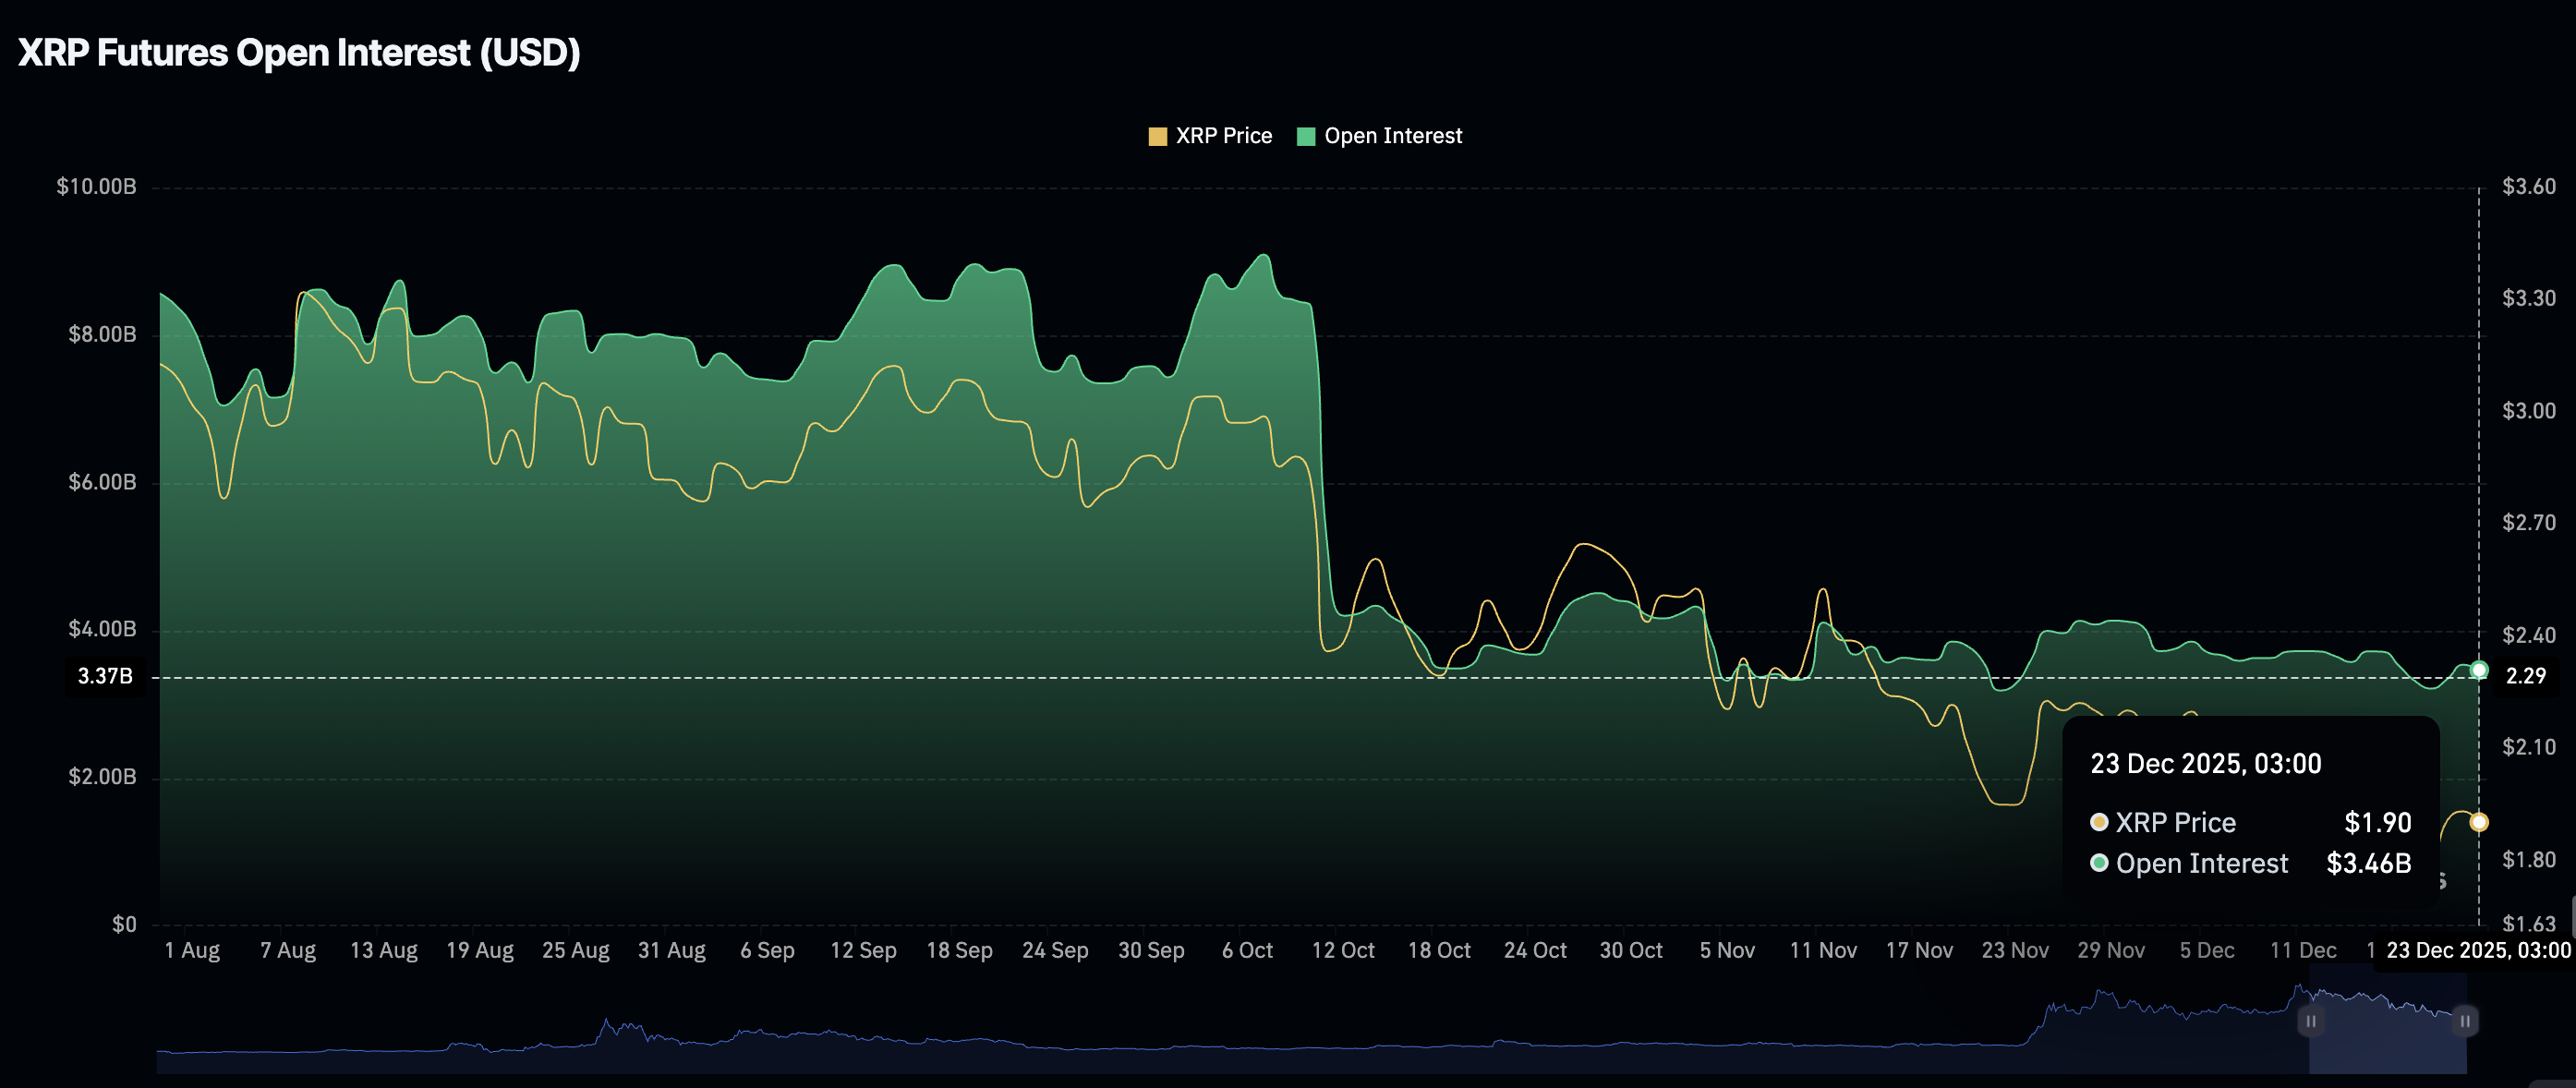
Despite steady ETF inflows, XRP faces a weak derivatives market, with futures Open Interest (OI) declining to $3.46 billion on Tuesday from $3.54 billion the previous day. OI has remained relatively subdued since mid-October, suggesting that traders lack confidence in the token’s ability to retain value.
Meanwhile, Bitcoin spot ETFs extended a three-day outflow streak, with approximately $142 million withdrawn on Monday. According to SoSoValue data, the cumulative net inflow stands at $57.26 billion with net assets averaging $115 billion. If the dominant risk-off sentiment persists, overhead pressure could overwhelm demand, increasing the odds of Bitcoin falling toward $80,000.
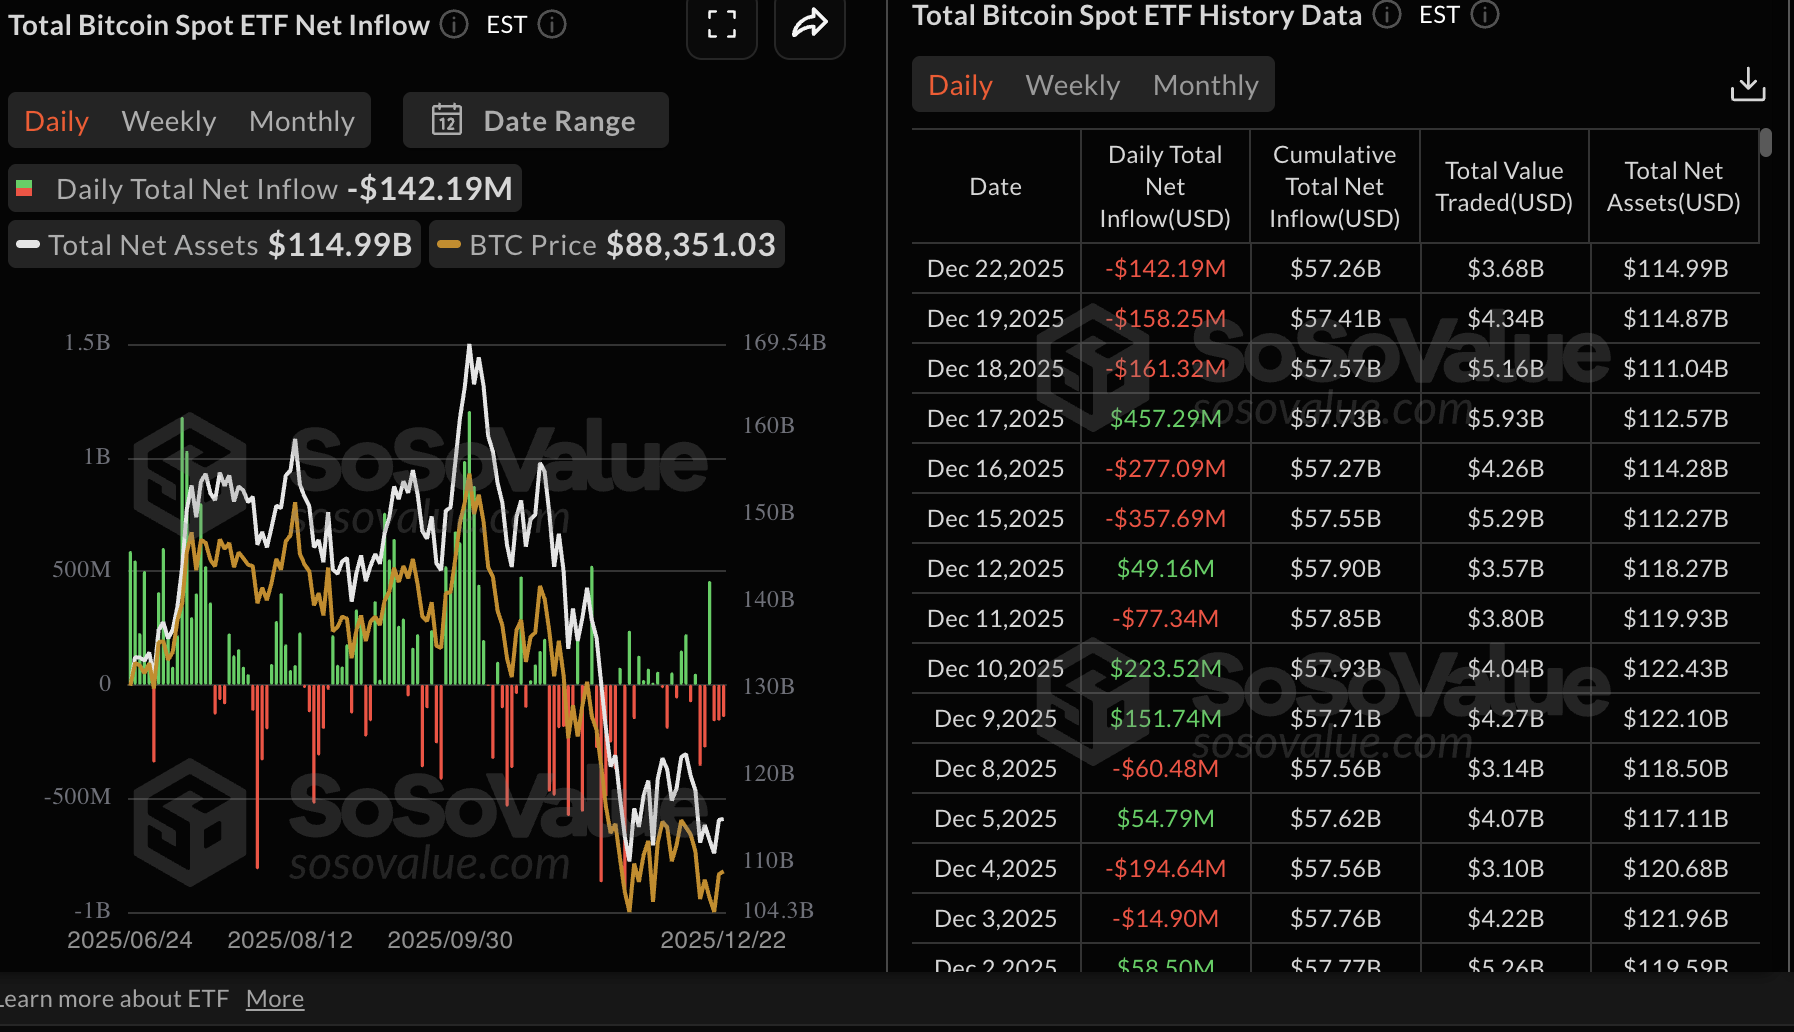
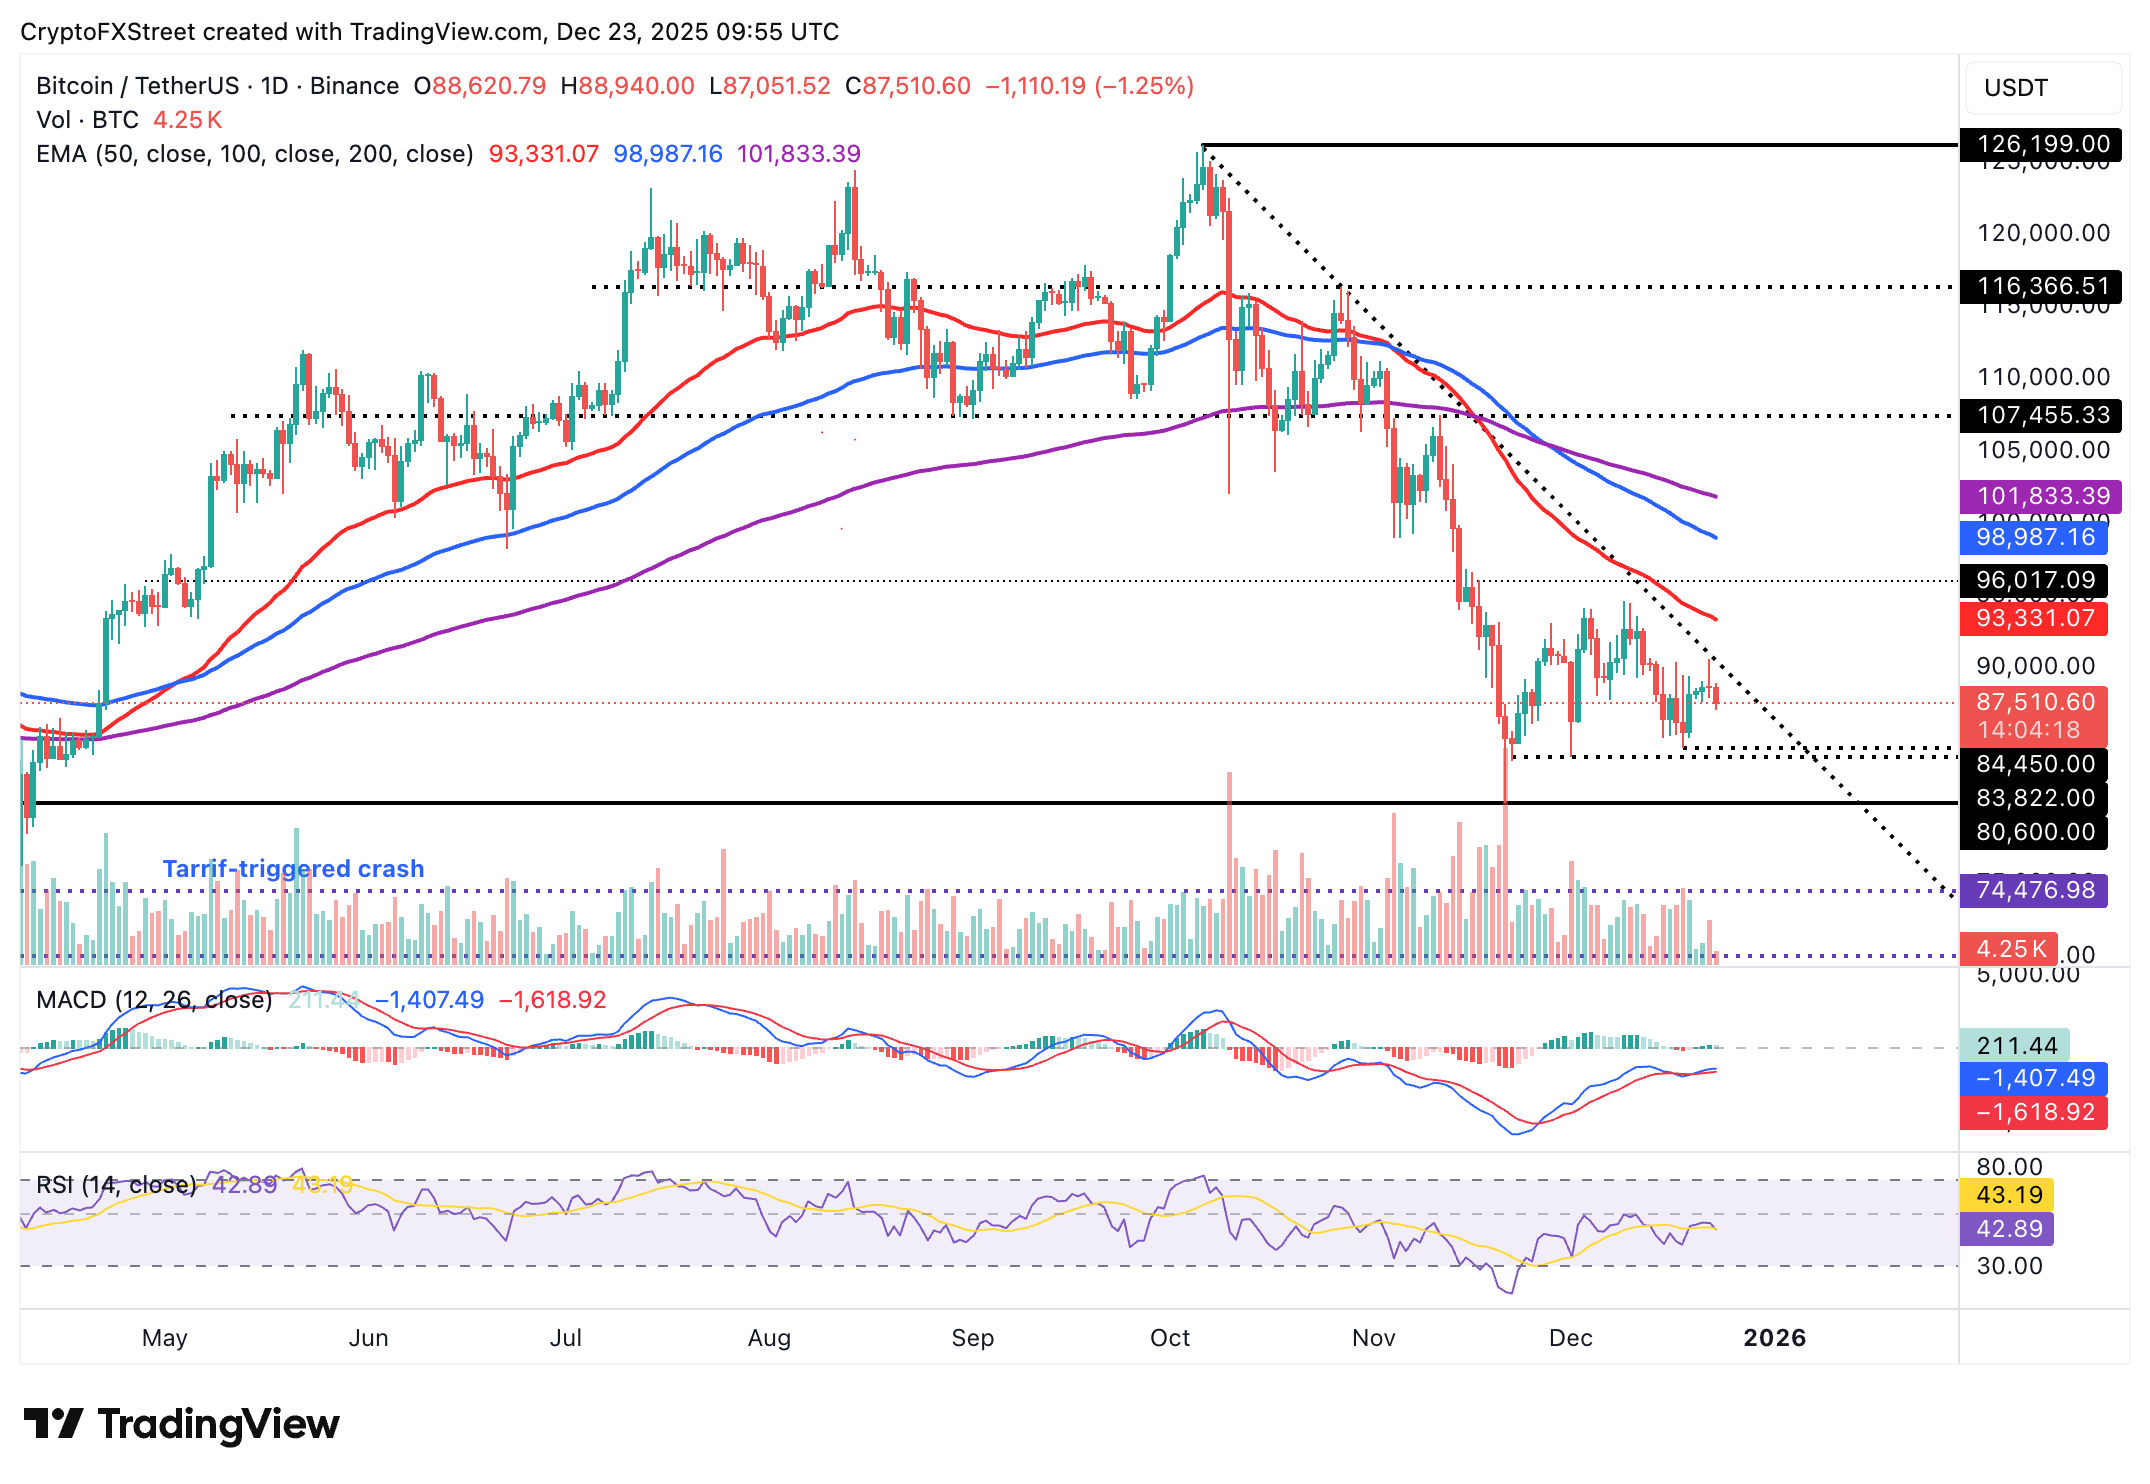
Chart of the day: Bitcoin holds short-term support
Bitcoin is holding above $87,000 short-term support at the time of writing on Tuesday. The downward-trending 50-day Exponential Moving Average (EMA) at $93,331, the 100-day EMA at $98,987 and the 200-day EMA at $101,833, reinforce the bearish outlook.
A descending trendline caps rebounds below $90,000, while the Relative Strength Index (RSI) has declined to 42 on the daily chart, emphasising increasing bearish momentum. A close below $87,000 could drive Bitcoin downward toward support at $84,450 and $83,822.
On the contrary, the Moving Average Convergence Divergence (MACD) indicator on the same chart highlights a buy signal, with the blue MACD line holding above the red signal line.
If green histogram bars expand above the mean line and the MACD rises into the bullish region, investors would be prompted to increase exposure, thus contributing to buying pressure and Bitcoin’s recovery potential above $90,000.
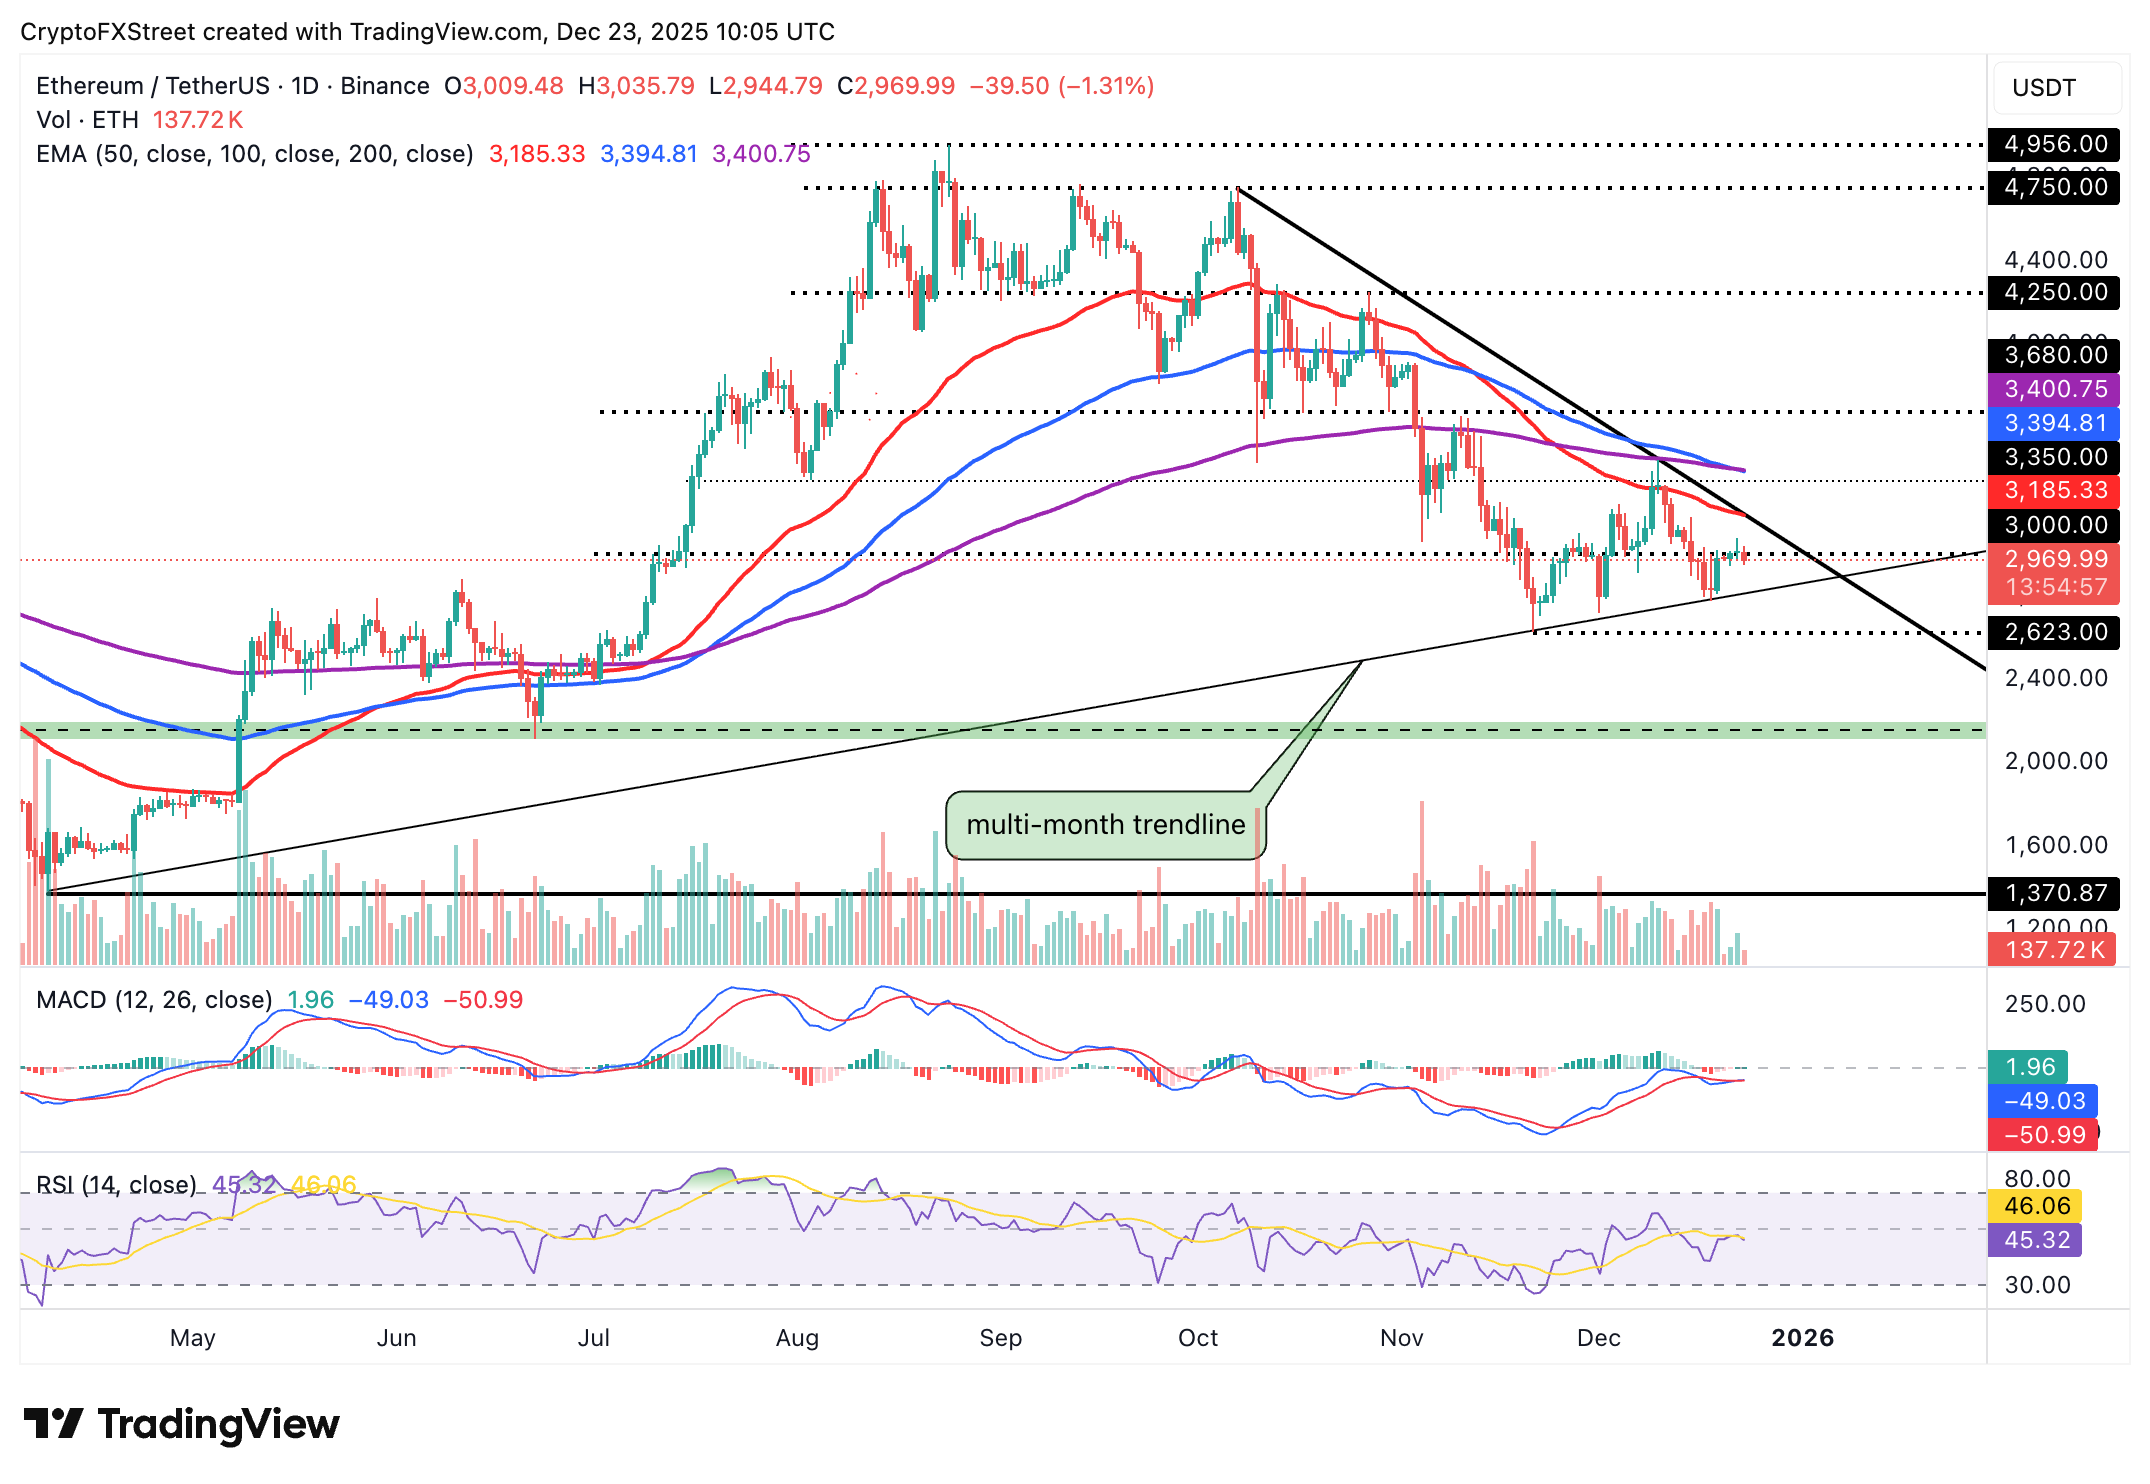
Altcoins update: Ethereum, XRP extend decline
Ethereum is trading below the pivotal $3,000 level, but remains above $2,900 short-term support at the time of writing on Tuesday. The falling 50-day EMA at $3,185, the 100-day EMA at $3,395 and the 200-day EMA at $3,401 signal that the prevailing bearish outlook could extend further.
The RSI has declined to 45 on the daily chart, indicating that bearish momentum is picking up. A further slope toward oversold territory would trigger a sell-off eyeing November’s support of $2,623.
An ascending trendline could provide relief to the buyers, especially if the MACD indicator upholds a buy signal and enters the bullish region. Green histogram bars above the mean line would also signal a potential shift to a bullish environment.
A key area of interest for traders is the 50-day EMA at $3,185, which should flip to support the uptrend. Failure to breach this level would keep Ethereum engulfed in overhead pressure.
As for XRP, sellers are largely in control at the time of writing on Tuesday. The cross-border remittance token is trading under pressure and below the key $2.00 level. The 50-day EMA at $2.12, the 100-day EMA at $2.31 and the 200-day EMA at $2.40 are sloping toward on the daily chart, which reinforces the overall bearish outlook.
XRP’s downtrend will likely continue in upcoming sessions if the RSI at 39 on the same chart extends the decline toward oversold territory. A close below the immediate $1.90 hurdle could accelerate the downtrend toward Friday’s support at $1.77 and April’s low of $1.62.
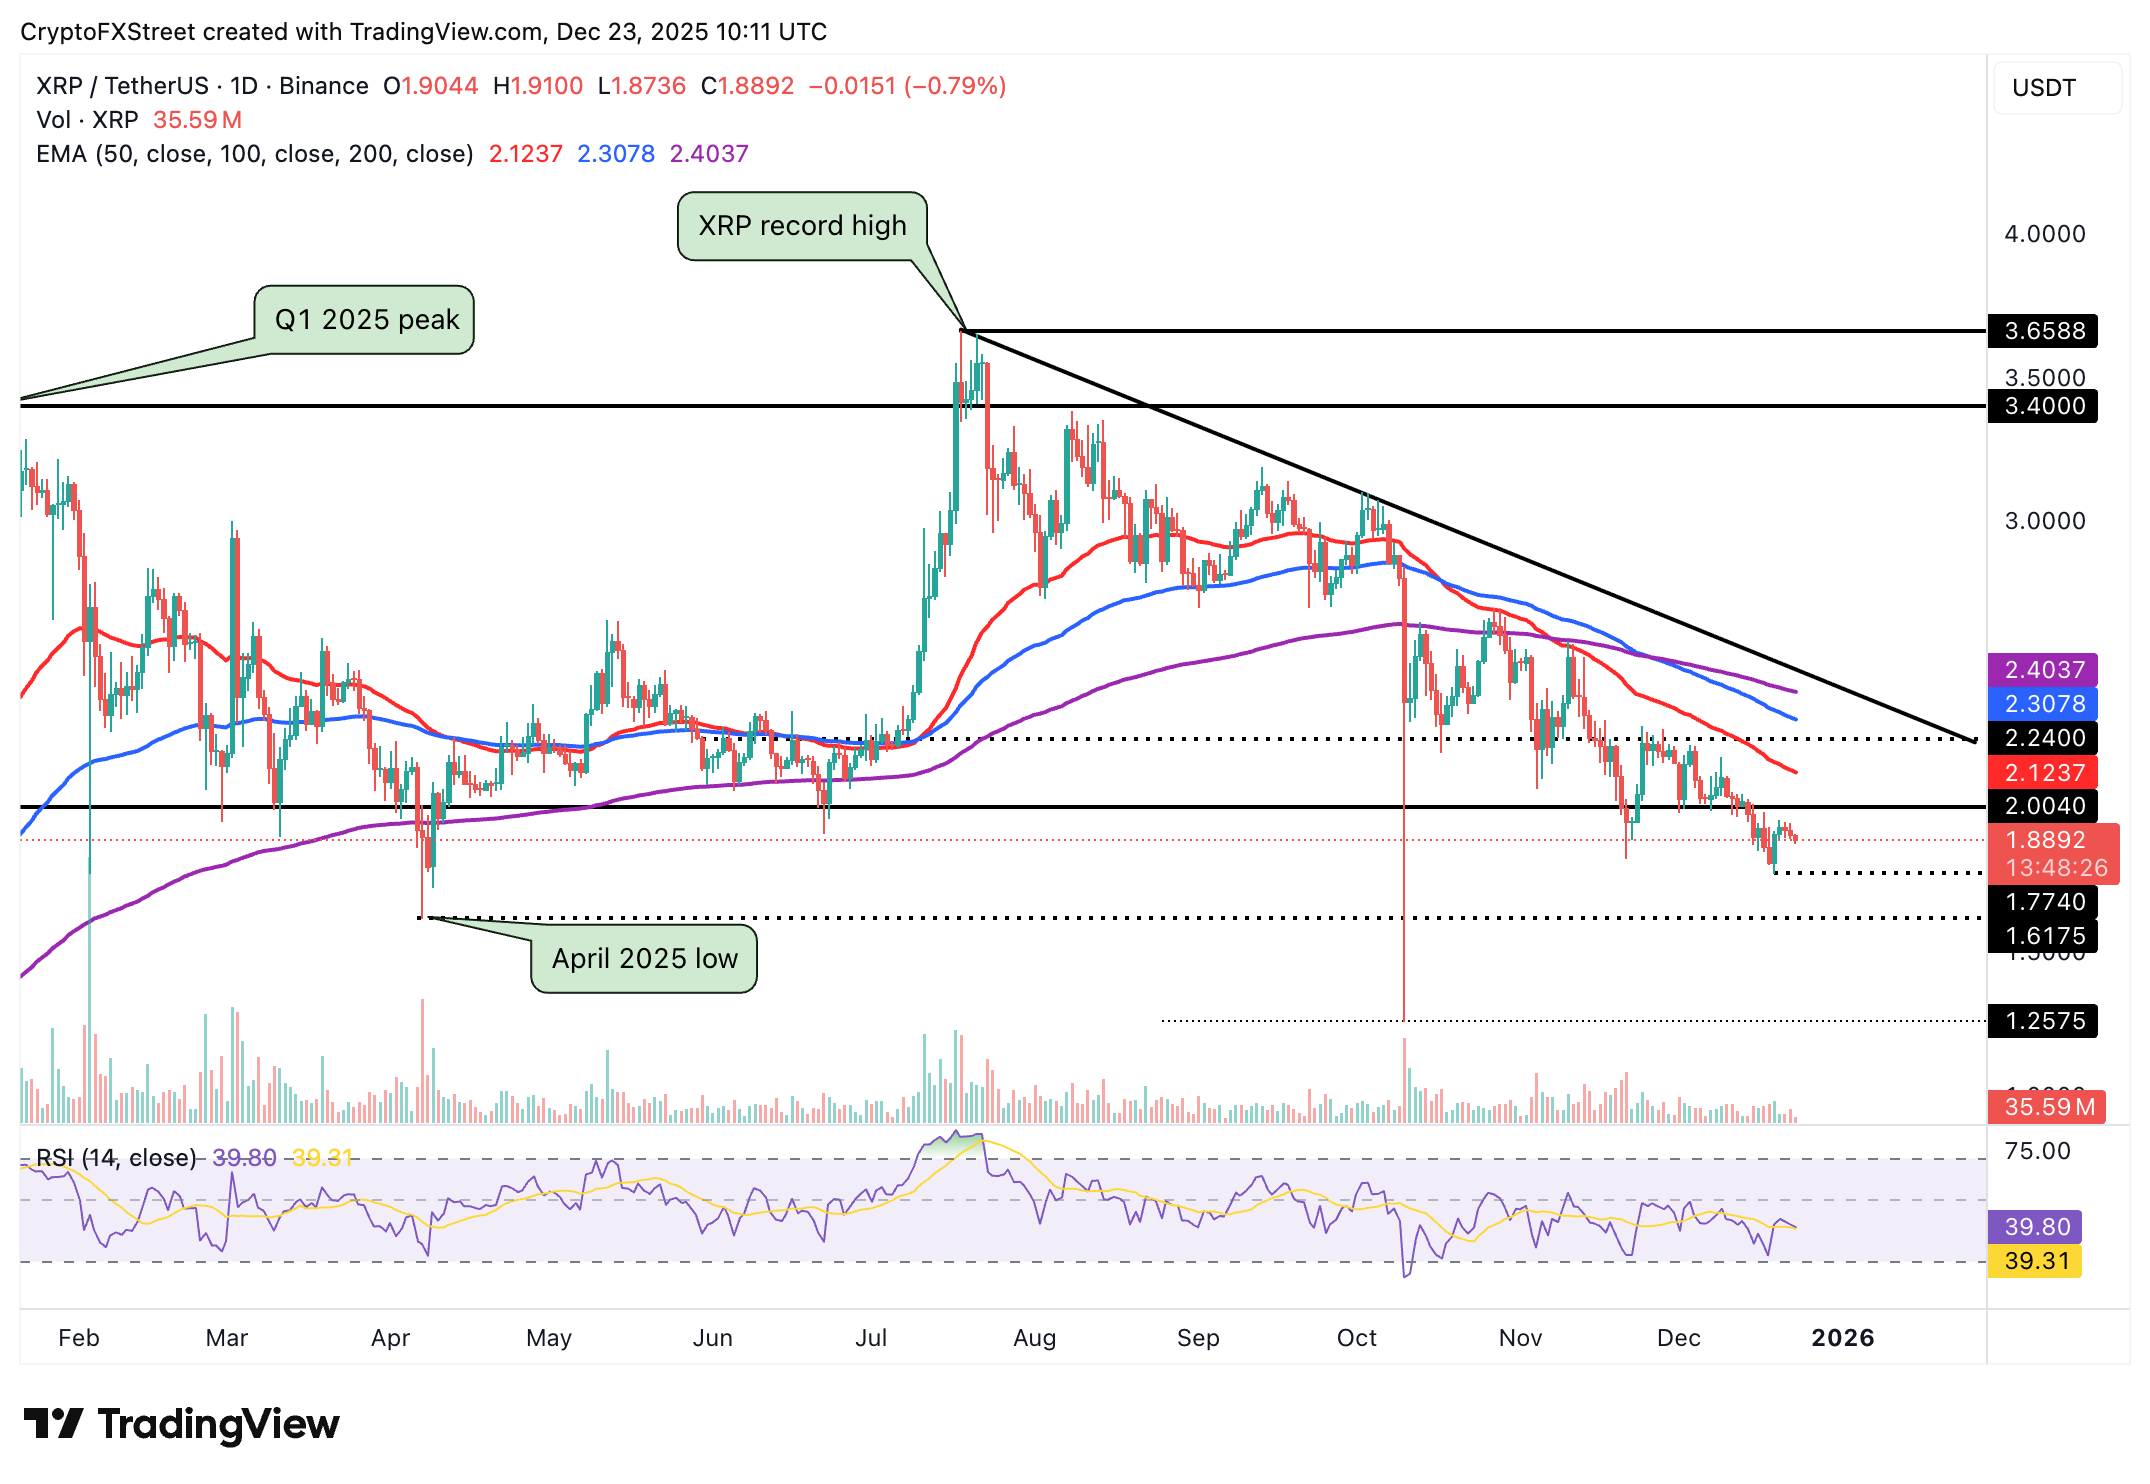
Still, if investors buy the dip and demand drives the price higher, the path with the least resistance would shift upward. A close above $2.00, and by extension, above the 50-day EMA at $2.12, would reinforce the bullish grip for a breakout beyond the 200-day EMA at $2.40.
Crypto ETF FAQs
An Exchange-Traded Fund (ETF) is an investment vehicle or an index that tracks the price of an underlying asset. ETFs can not only track a single asset, but a group of assets and sectors. For example, a Bitcoin ETF tracks Bitcoin’s price. ETF is a tool used by investors to gain exposure to a certain asset.
Yes. The first Bitcoin futures ETF in the US was approved by the US Securities & Exchange Commission in October 2021. A total of seven Bitcoin futures ETFs have been approved, with more than 20 still waiting for the regulator’s permission. The SEC says that the cryptocurrency industry is new and subject to manipulation, which is why it has been delaying crypto-related futures ETFs for the last few years.
Yes. The SEC approved in January 2024 the listing and trading of several Bitcoin spot Exchange-Traded Funds, opening the door to institutional capital and mainstream investors to trade the main crypto currency. The decision was hailed by the industry as a game changer.
The main advantage of crypto ETFs is the possibility of gaining exposure to a cryptocurrency without ownership, reducing the risk and cost of holding the asset. Other pros are a lower learning curve and higher security for investors since ETFs take charge of securing the underlying asset holdings. As for the main drawbacks, the main one is that as an investor you can’t have direct ownership of the asset, or, as they say in crypto, “not your keys, not your coins.” Other disadvantages are higher costs associated with holding crypto since ETFs charge fees for active management. Finally, even though investing in ETFs reduces the risk of holding an asset, price swings in the underlying cryptocurrency are likely to be reflected in the investment vehicle too.
บทความแนะนำ


