
Maple Finance Price Forecast: SYRUP rebounds as whale wallets accumulate amid market weakness
- SYRUP extends gains for the third consecutive day on Thursday, approaching a key resistance zone.
- On-chain data shows that certain whale wallets are accumulating SYRUP during recent price dips.
- The technical outlook indicates a potential rebound, as momentum indicators suggest that bearish pressure is easing.
Maple Finance (SYRUP) price is extending its gains for the third consecutive day, trading above $0.27 on Thursday, despite the weakness in the crypto market this week. The ongoing price rebound is further supported by large whale wallets accumulating SYRUP during recent price dips. Moreover, technical analysis indicates a recovery, with momentum indicators signaling that bearish pressure is easing.
Maple Finance climbs as whales buy the dip
Santiment’s Supply Distribution data supports a bullish outlook for Maple Finance, as certain whales are buying SYRUP at recent price dips.
The metric indicates that whales holding between 100,000 and 1 million SYRUP tokens (red line) and 10 million and 100 million tokens (blue line) have accumulated a total of 48.31 million SYRUP tokens from December 13 to Thursday. During the same period, wallets holding between 1 million and 10 million SYRUP tokens (yellow line) have shed 42.94 million tokens.
This suggests that the second cohort of whales may have been affected by the capitulation event. In contrast, the first set of wallets seized the opportunity and accumulated Maple Finance at a discount.
 [12-1766046887660-1766046887662.44.30, 18 Dec, 2025].png)
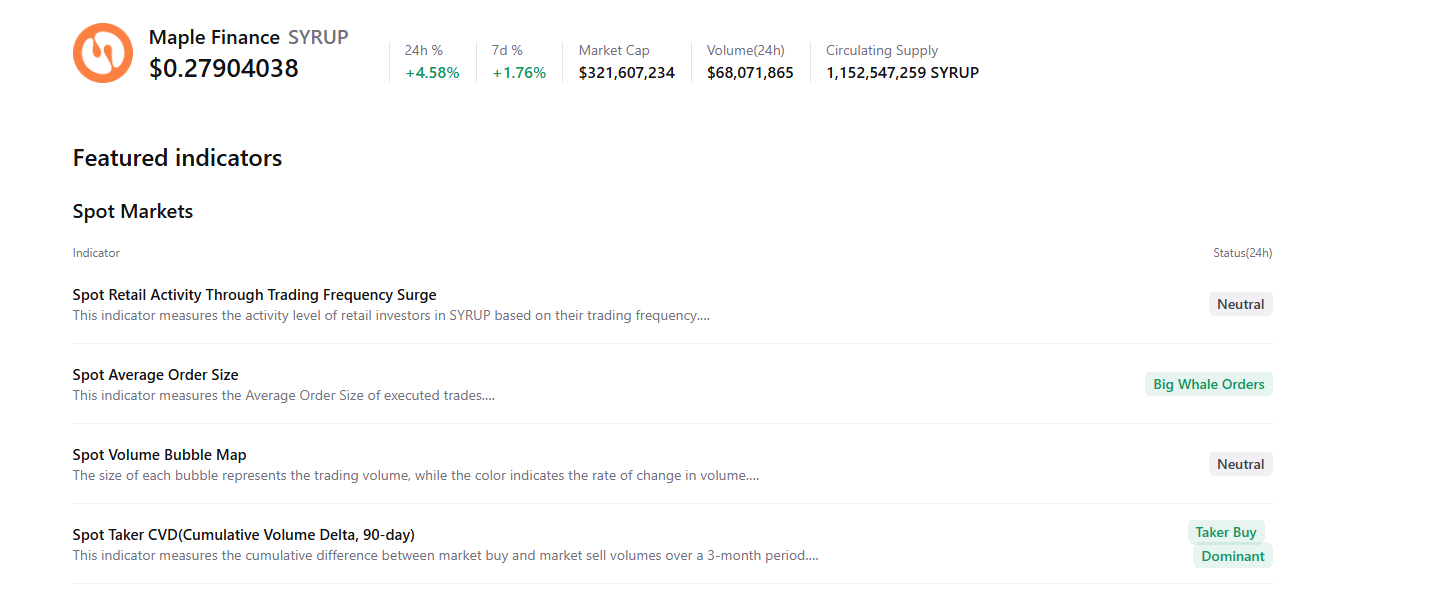
CryptoQuant’s summary data supports the positive outlook, as Maple Finance’s spot markets show large whale orders and buy dominance, signaling a potential recovery ahead.
Maple Finance Price Forecast: SYRUP momentum indicators show easing bearish pressure
Maple Finance's price has been extending its recovery for the third consecutive day since Tuesday, gaining nearly 7% so far this week. As of Thursday, SYRUP is nearing its key resistance level at $0.28, the 38.2% Fibonacci retracement (from the July 25 high of $0.68 to the October 10 low of $0.04).
If SYRUP breaks and closes above the $0.28 resistance level on a daily basis, it could extend the rally toward the 50-day Exponential Moving Average (EMA) at $0.31.
The Relative Strength Index (RSI) on the daily chart reads 45, pointing upward toward the neutral level of 50, indicating fading bearish momentum. For the bullish momentum to be sustained, the RSI must move above the neutral level. Additionally, the Moving Average Convergence Divergence (MACD) indicator showed a bullish crossover last week, which remains intact, further supporting the bullish outlook.
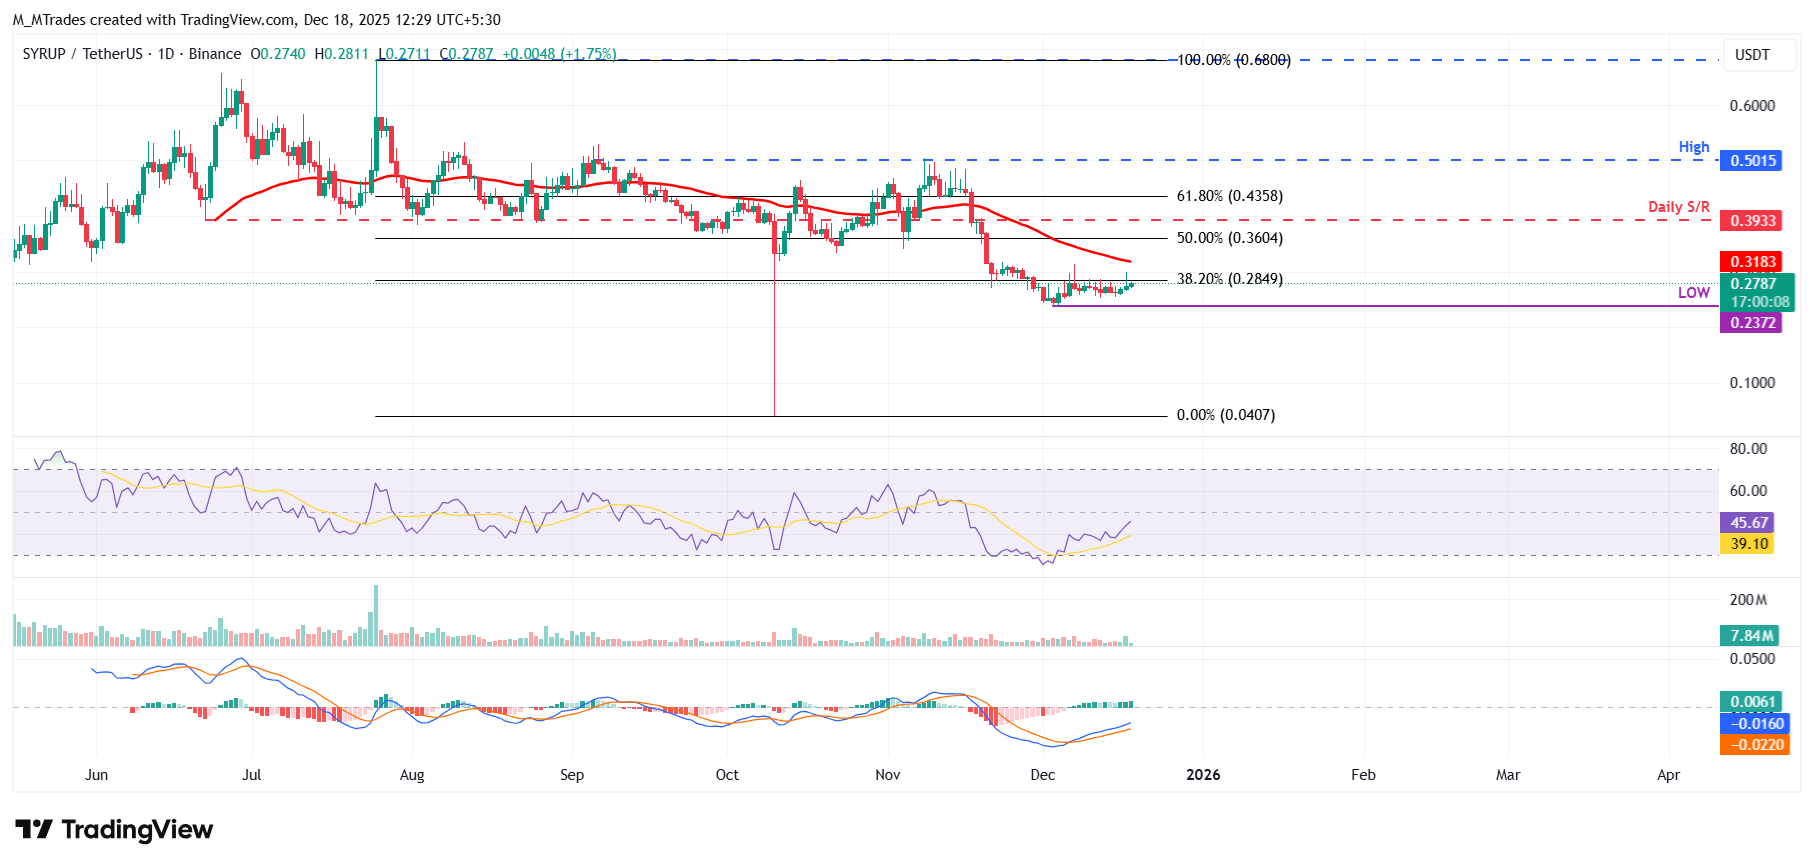
On the other hand, if SYRUP faces a correction, it could extend the decline toward the December 3 low of $0.23.
บทความแนะนำ


