


Meme Coins Price Prediction: Dogecoin, Shiba Inu, and Pepe risk breaking monthly support levels
- Dogecoin struggles to hold above $0.18 after four consecutive days of losses.
- Shiba Inu slips below $0.00001000 psychological level, risking a potential consolidation breakdown.
- Pepe risks breaking below its monthly support base as selling pressure resumes.
Meme coins such as Dogecoin (DOGE), Shiba Inu (SHIB), and Pepe (PEPE) record significant losses in the ongoing broader cryptocurrency market sell-off. DOGE, SHIB, and PEPE test their crucial support levels, risking further losses if broader market sentiment declines.
Investors pull out of meme coins
Meme coins, particularly during a market correction phase, are known to lead the decline, as they are highly volatile and driven by speculation. CoinGlass data shows that in the last 24 hours, the futures Open Interest (OI) of DOGE, SHIB, and PEPE has decreased by 3%, 12%, and 9%, respectively, to reach $1.75 billion, $78.52 million, and $242.12 million. The decline in OI indicates a decrease in the notional value of all outstanding futures contracts, suggesting that traders are becoming risk-averse and moving to the sidelines.
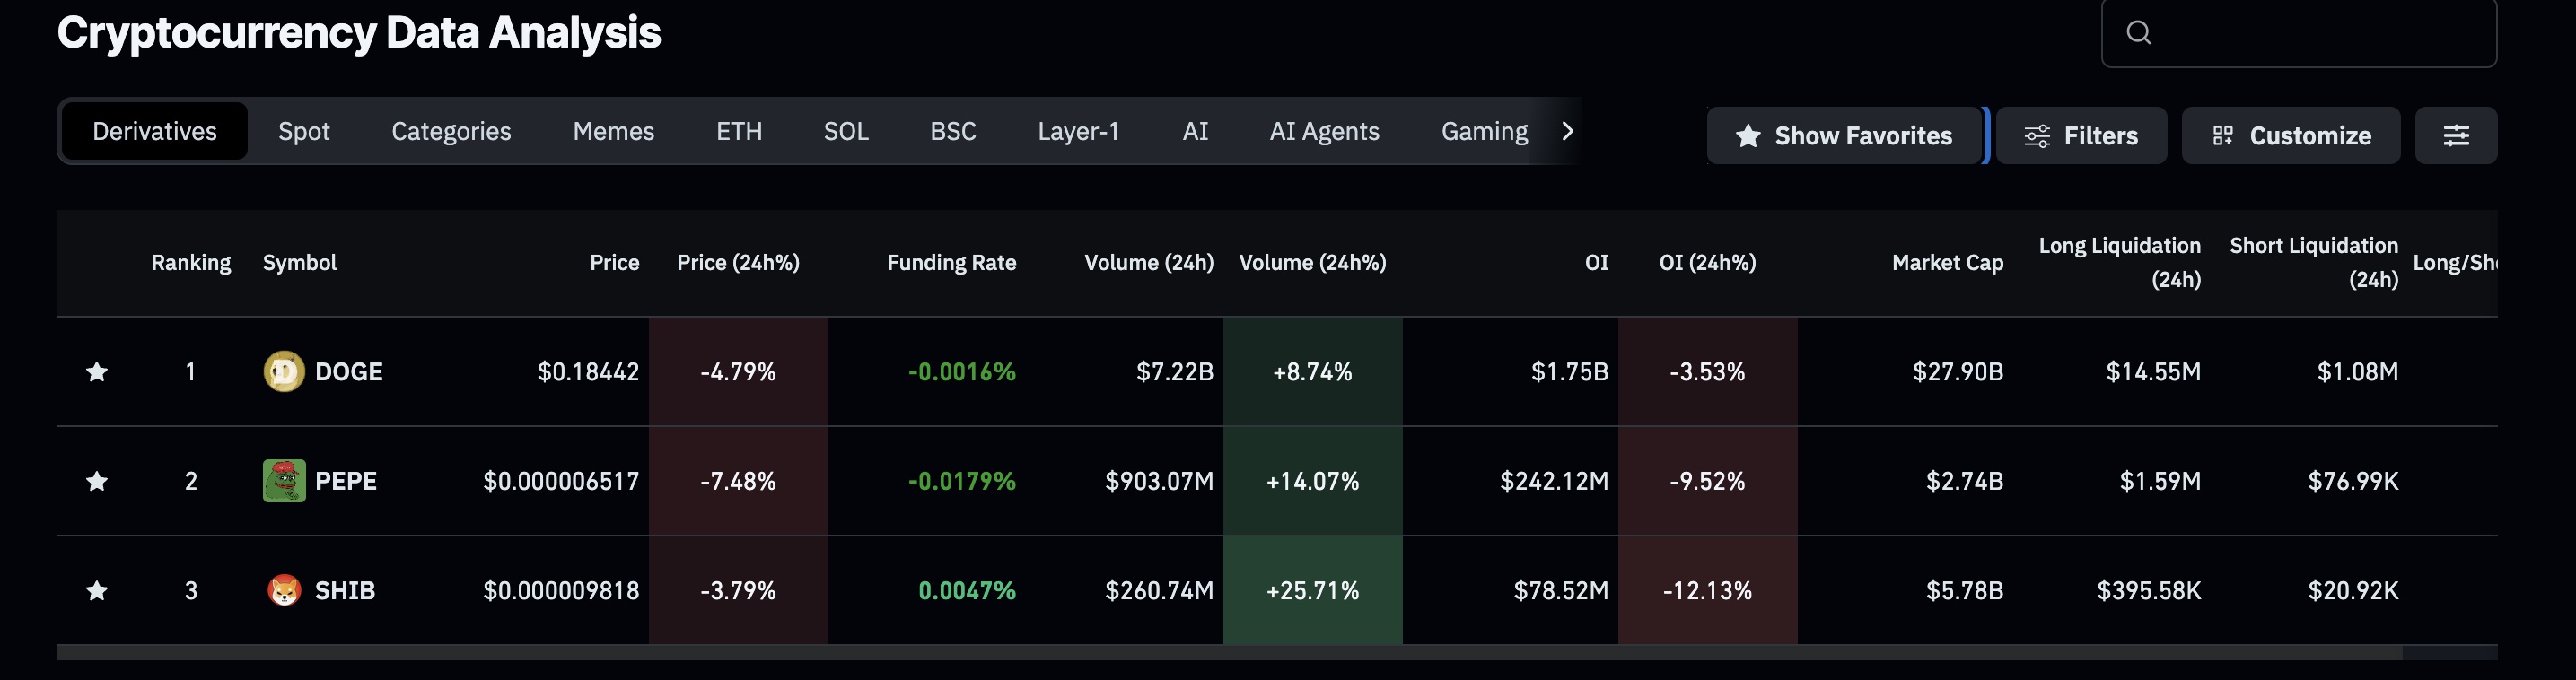
Meme coins derivatives data. Source: CoinGlass
Dogecoin is back at the monthly support, as sellers have the upper hand
Dogecoin trades above $0.18000 at press time on Friday, after four consecutive days of losses. The ongoing pullback aligns with the 50-day Exponential Moving Average (EMA) crossing below the 200-day EMA, resulting in a Death Cross pattern. This suggests a more pronounced short-term bearish trend.
Dogecoin put the $0.17816 support level, marked by the October 11 low, to the test for the third time this month so far, on Thursday. A potential close below this level could exacerbate losses to the $0.14270 low from June 22.
The momentum indicators on the 4-hour chart indicate low buying pressure as the Moving Average Convergence Divergence (MACD) reverses to the signal line, risking a bearish crossover. At the same time, the Relative Strength Index (RSI) at 39 hovers between the halfway line and oversold boundary, indicating a bearish incline.
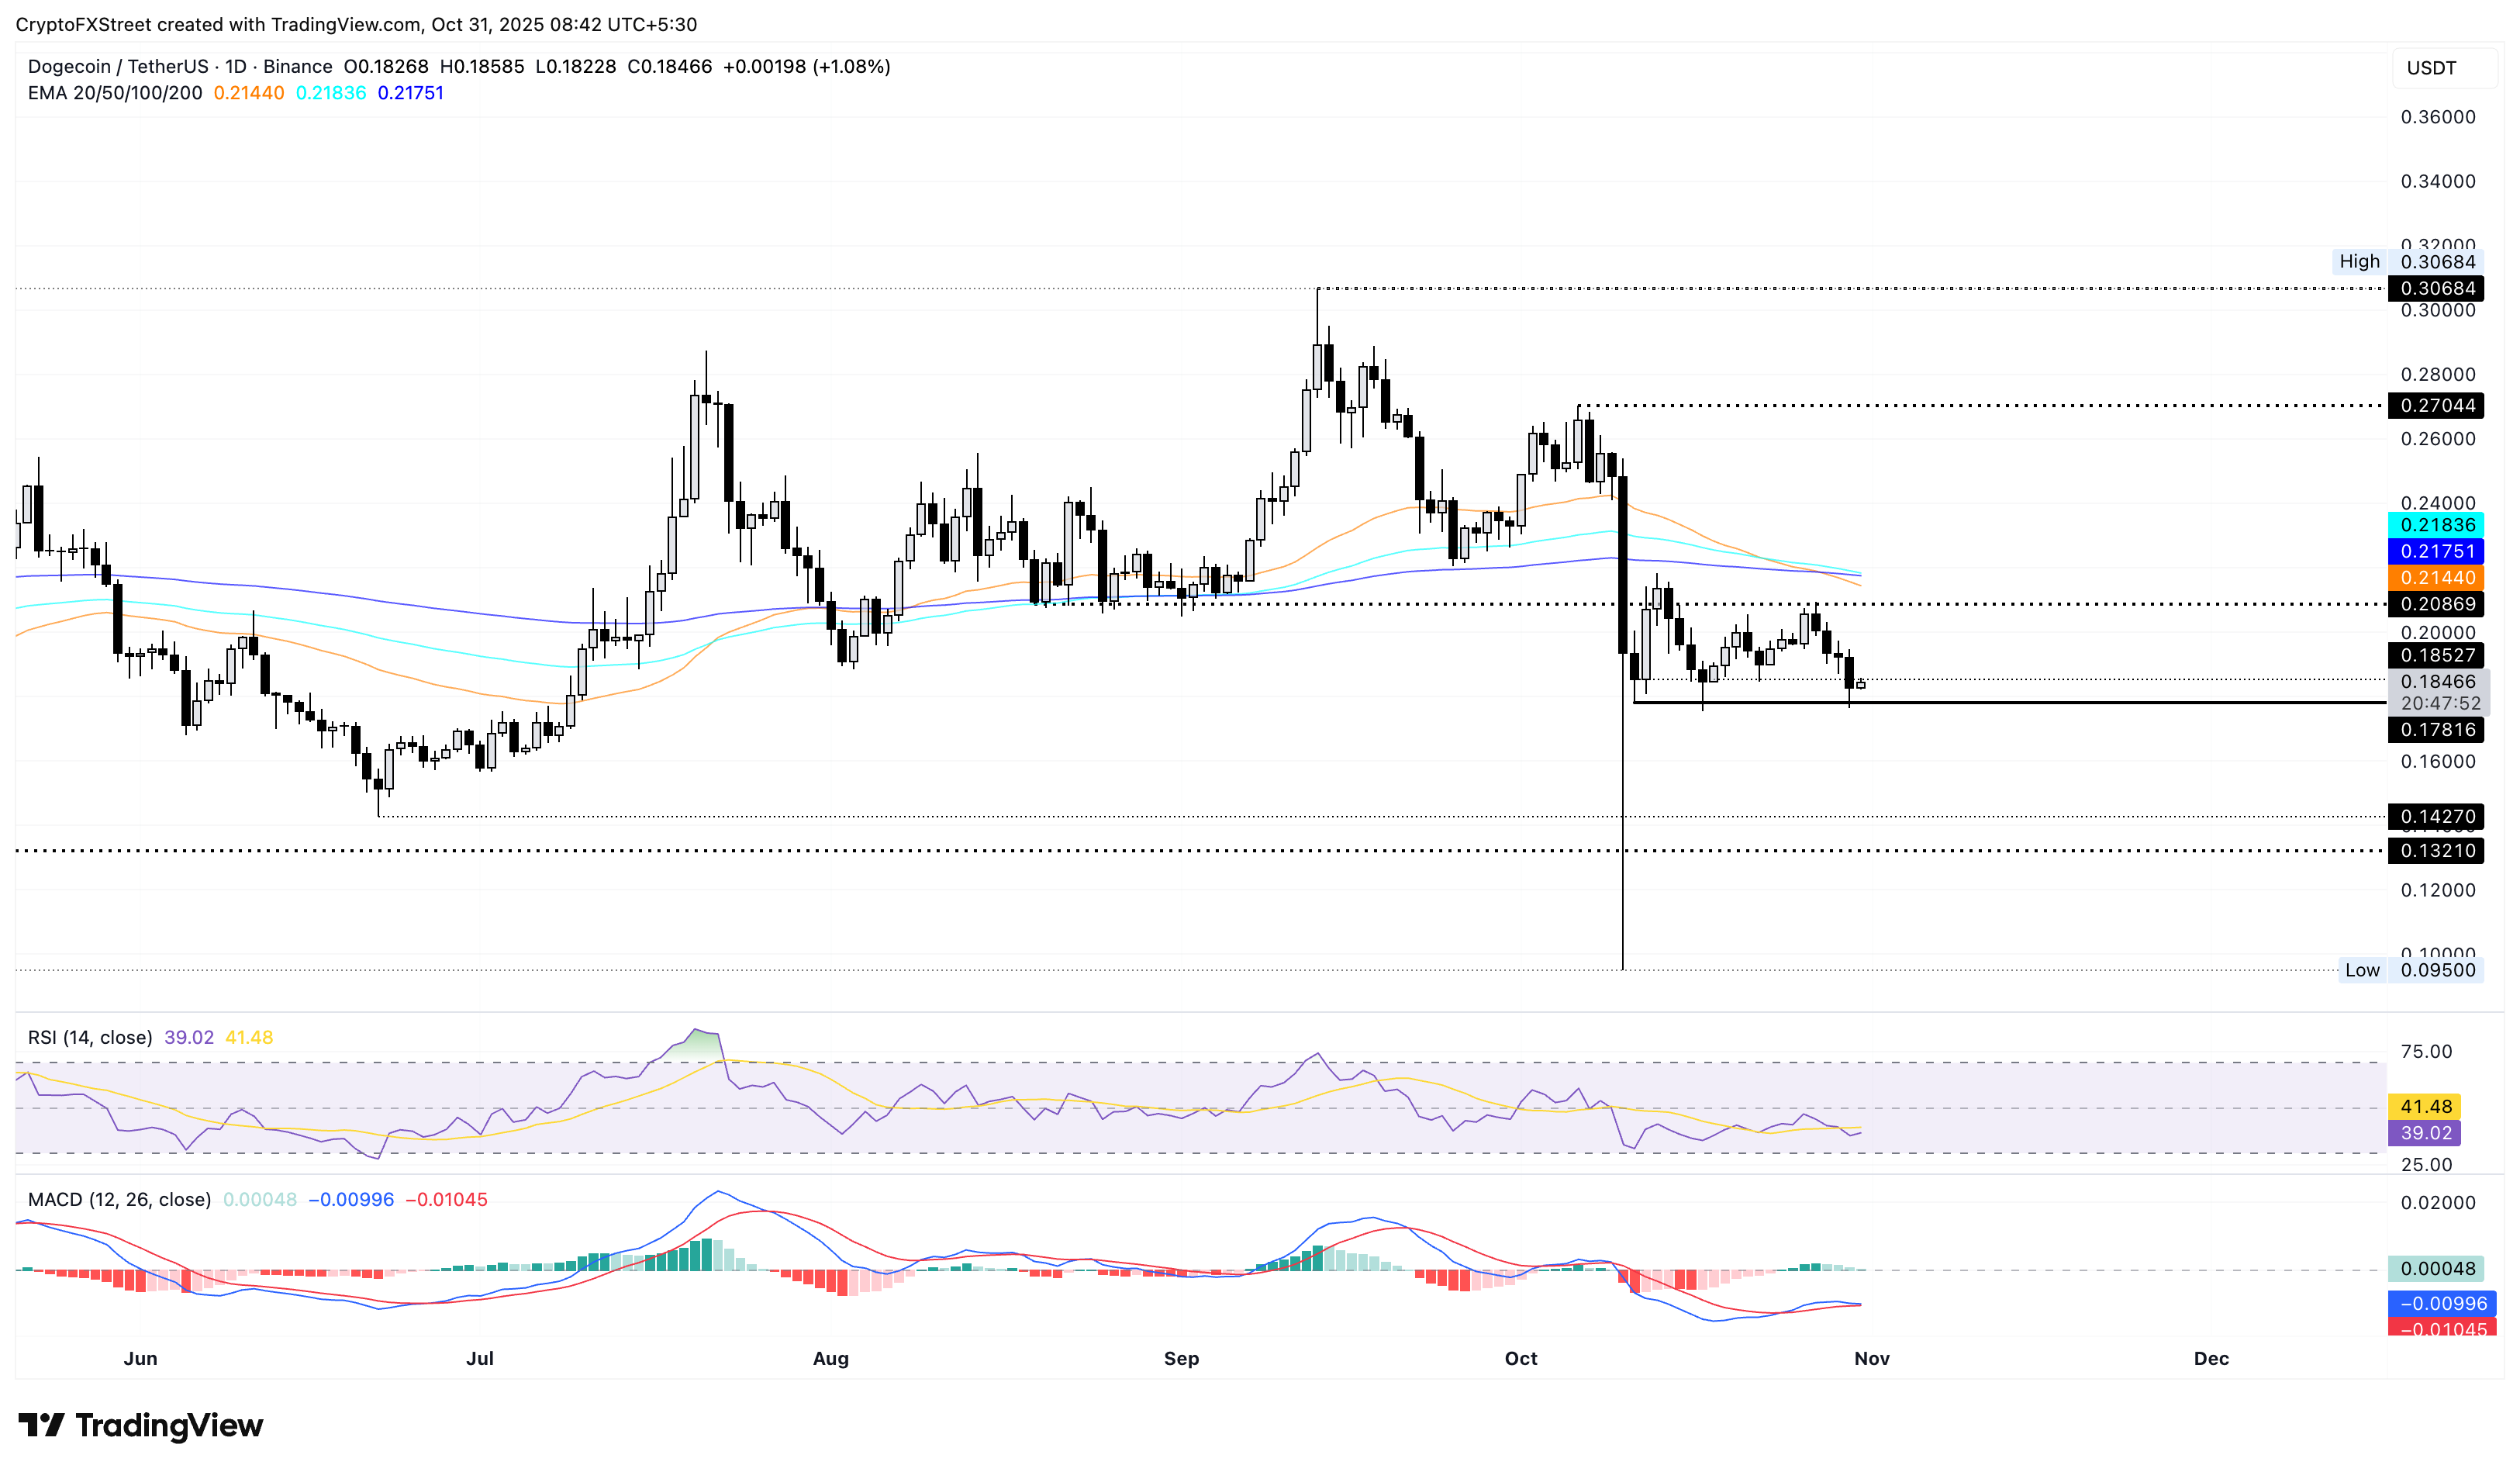
DOGE/USDT daily price chart.
If DOGE bounces back from $0.17819, it could retest the $0.20869 level, marked by the August 19 low.
Shiba Inu recovery aims to reclaim a psychological level
Shiba Inu rebounds towards the $0.00001000 psychological level on the 4-hour chart, after the 4% drop on Thursday. At the time of writing, SHIB edges higher by 1% on Friday, with bulls aiming to reclaim the psychological mark.
The meme coin struggles to surface above the S1 Pivot Point at $0.00000987 after bouncing back from near the $0.00000924 level, marked by the October 17 low.
Shiba Inu finds renewed buying pressure after the sell-off phase in the previous session. The MACD approaches the signal line, aiming to cross above and flash a renewed bullish momentum. Meanwhile, the RSI at 42 shows a V-shaped reversal from the oversold zone.
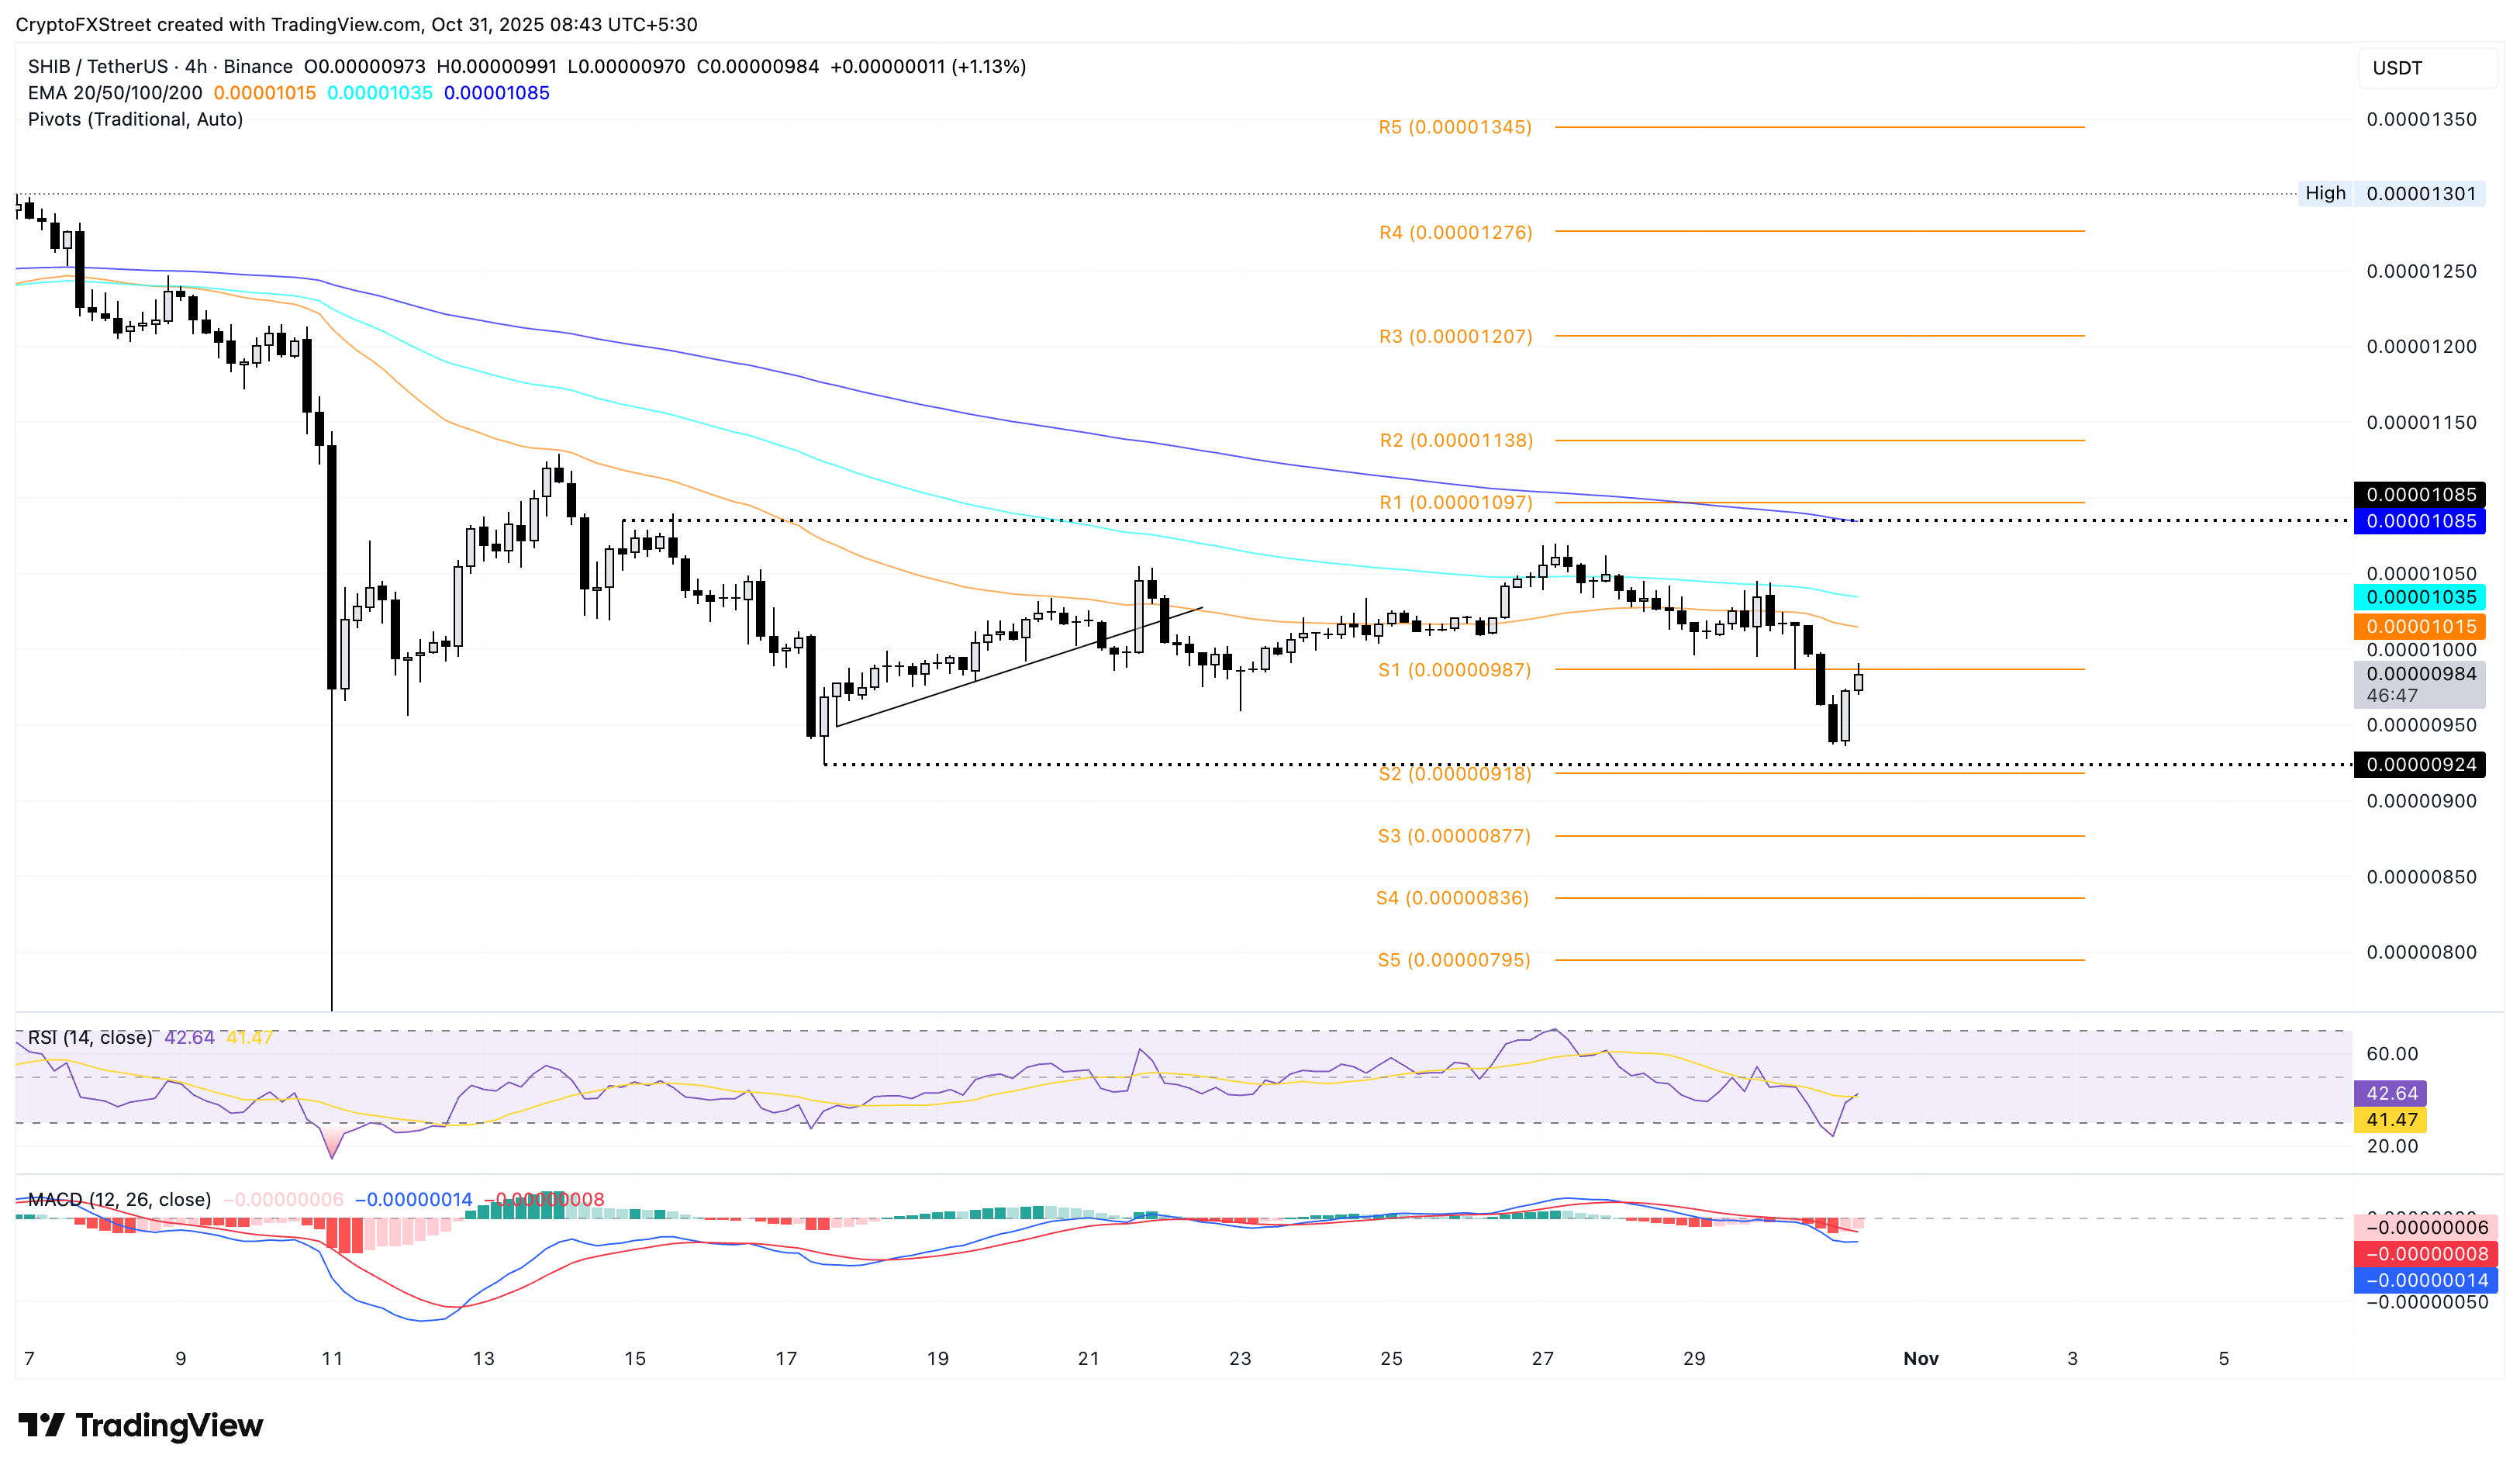
SHIB/USDT 4-hour price chart.
If SHIB establishes an uptrend, it could encounter resistance from the declining 50-period and 200-period EMAs at $0.00001015 and $0.00001085, respectively.
Pepe at key support risks further losses
Pepe ticks higher by 2% at press time on Friday, after four consecutive bearish candles on the daily chart. The frog-themed meme coin is currently holding at the S2 Pivot Point at $0.00000645, which has provided multiple levels of support and remained intact since October 11.
However, the ongoing pullback risks further losses if the price closes below this level. If this happens, PEPE could free-fall towards the $0.00000653 level, marked by the March 11 low, followed by the S3 Pivot Point at $0.00000404.
Technical indicators on the daily chart signal elevated selling pressure, as the RSI at 36 hovers above the oversold boundary, while the MACD and signal line reverse, risking a bearish crossover.
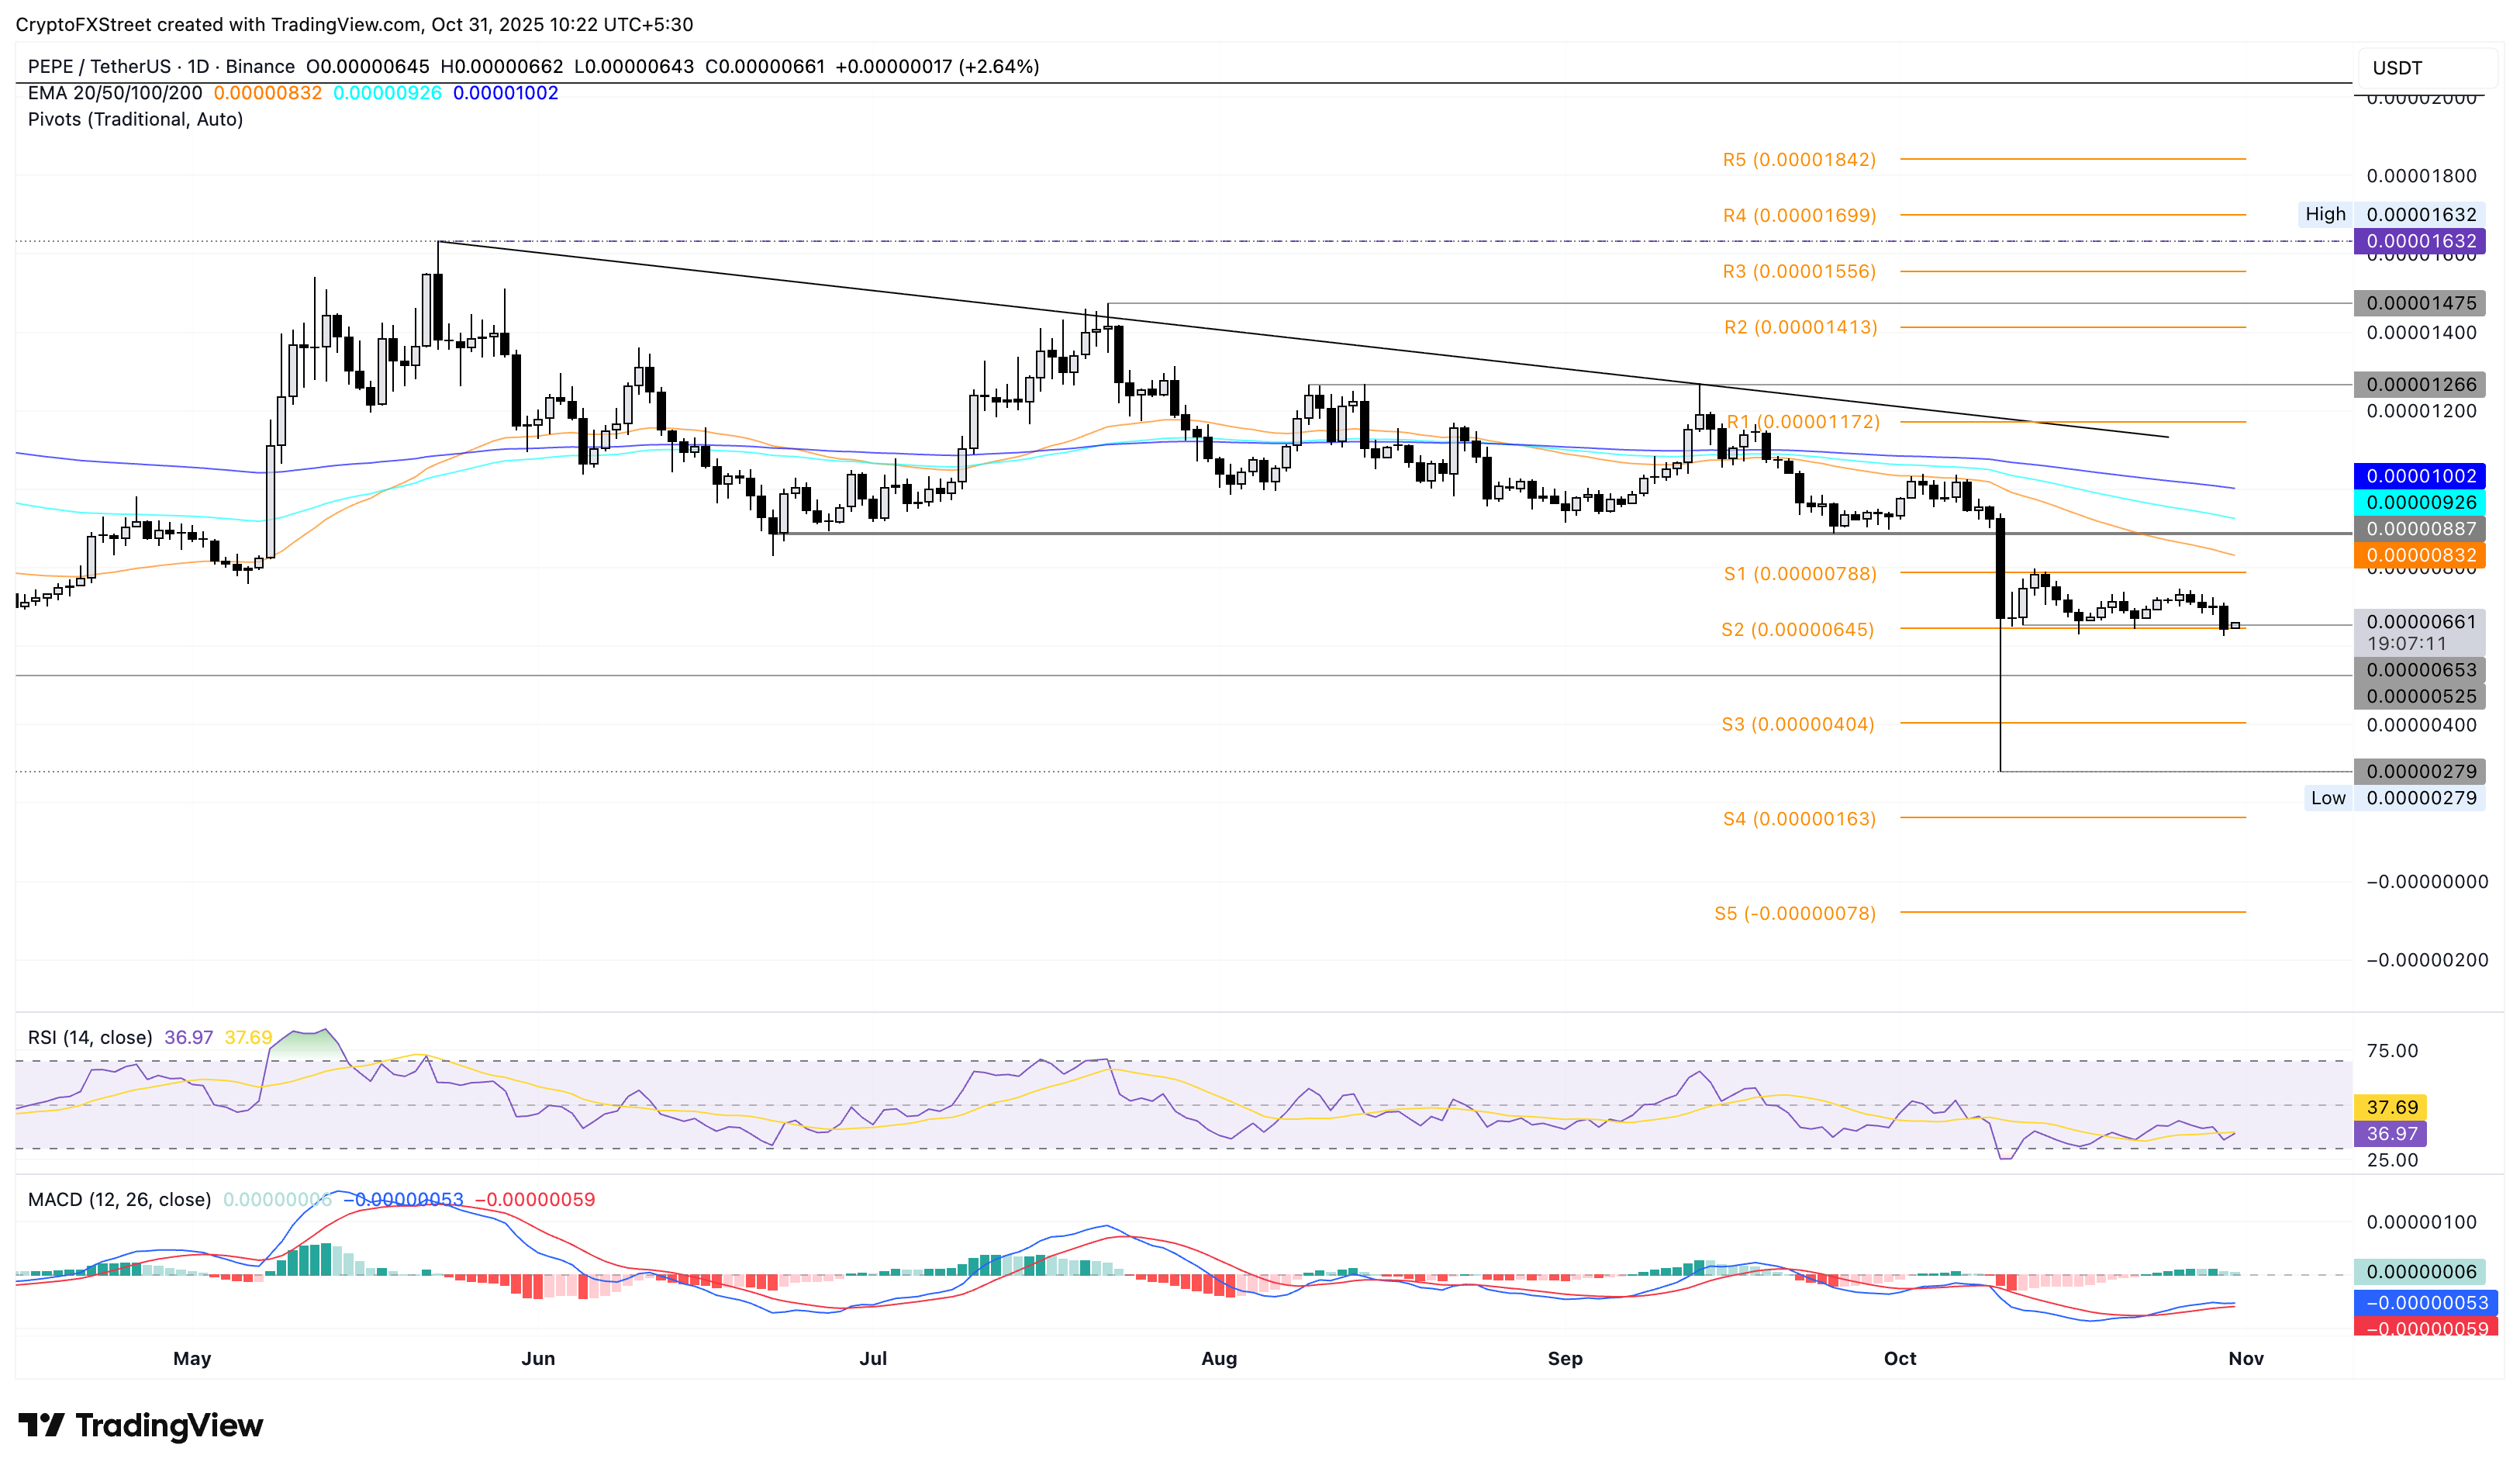
PEPE/USDT daily price chart.
If PEPE bounces back from $0.00000645, it could extend the recovery to the S1 Pivot Point at $0.00000788.
บทความแนะนำ


