


Crypto Today: Bitcoin, Ethereum, XRP advance, flipping resistance into support
- Bitcoin reclaims the 50-day and 100-day EMAs as sentiment in the broader cryptocurrency market steadies.
- Ethereum extends recovery as bulls tighten grip despite two consecutive weeks of ETF outflows.
- XRP holds above $2.61 support, backed by traders increasing risk exposure.
Bitcoin (BTC) edges higher, trading above $115,000 on Monday, reflecting steady sentiment across the cryptocurrency market. Altcoins, including Ethereum (ETH) and Ripple (XRP), are signaling bullishness as investors seek exposure in the wake of extreme volatility seen in October's second and third weeks.
Data spotlight: Bitcoin ETFs inflows return as Ethereum lags
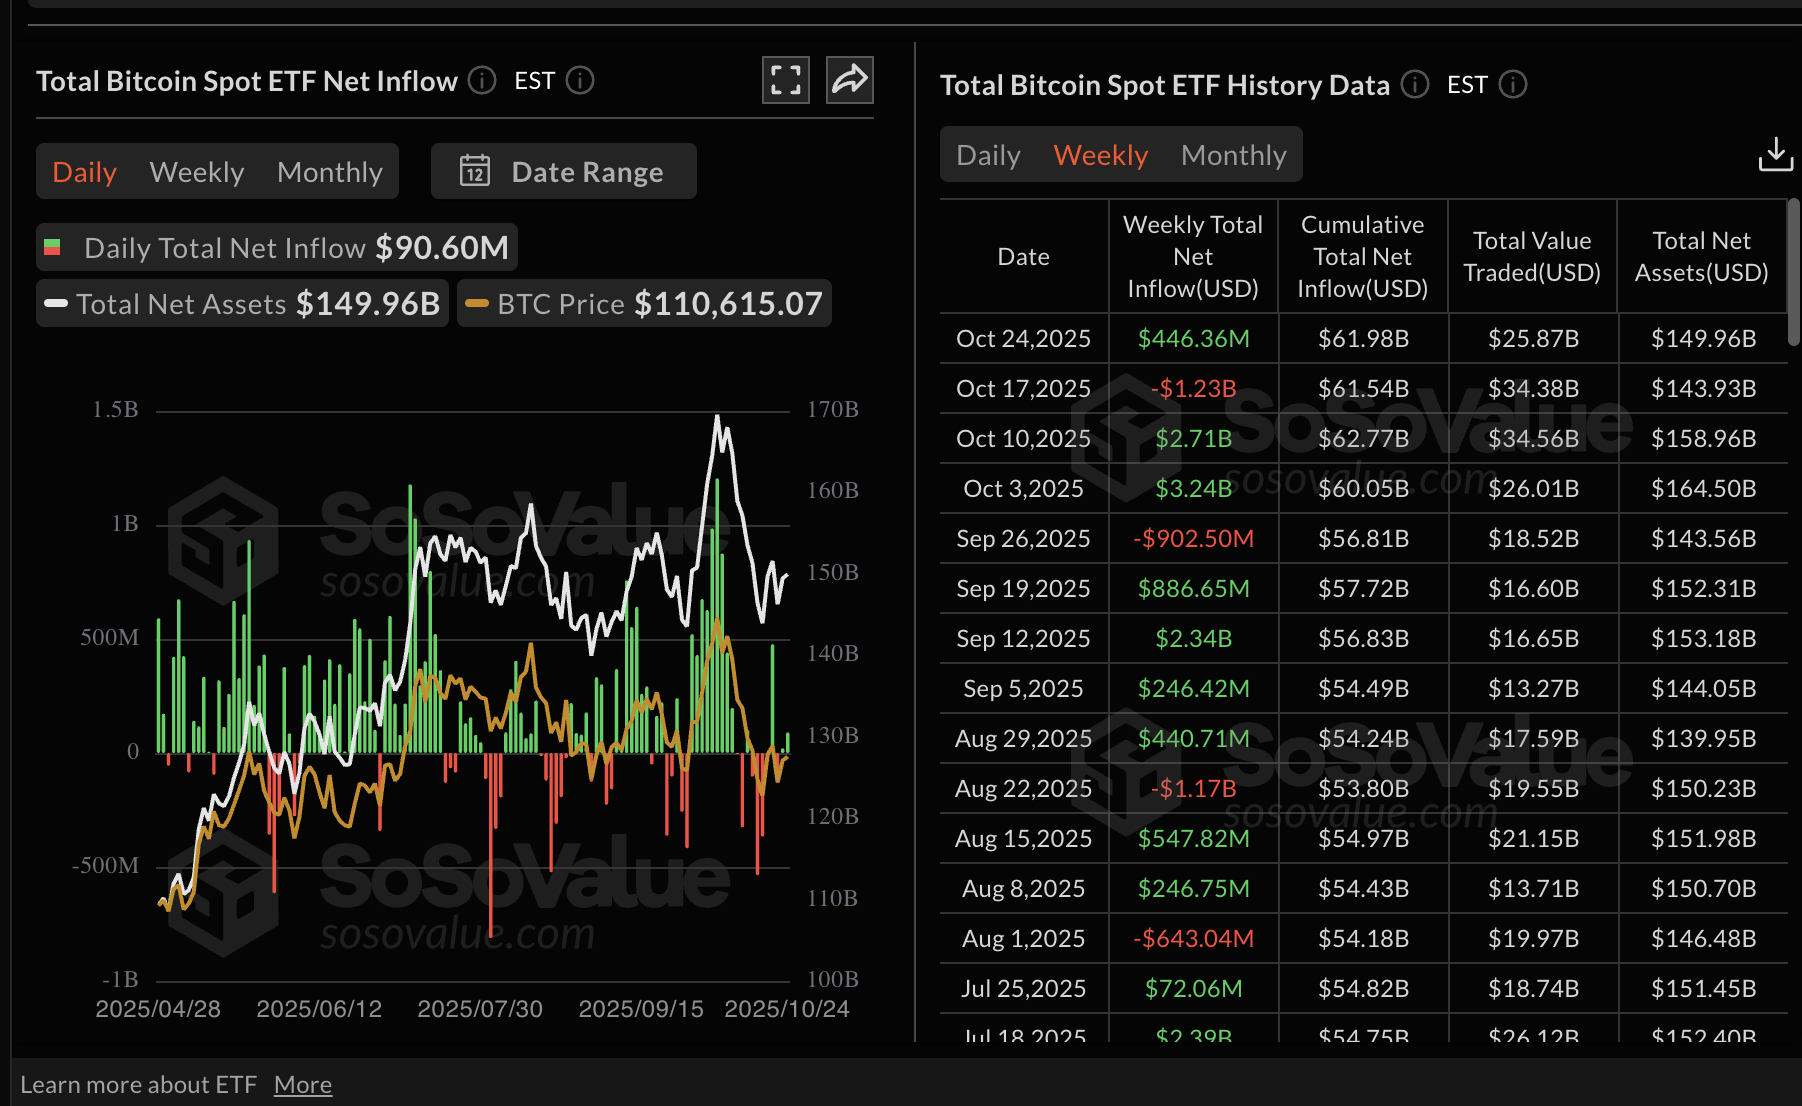
Bitcoin Exchange Traded Funds (ETFs) saw $446 million in net inflow volume last week, reversing the trend from the $1.23 billion in outflows the week prior. According to SoSoValue data, US-listed ETFs experienced inflows on three of five days last week, highlighting the growing interest from institutional investors.
If this trend steadies this week, it would bolster Bitcoin's outlook, increasing the odds of a breakout above $120,000.
Bitcoin ETF stats | Source: CoinGlass
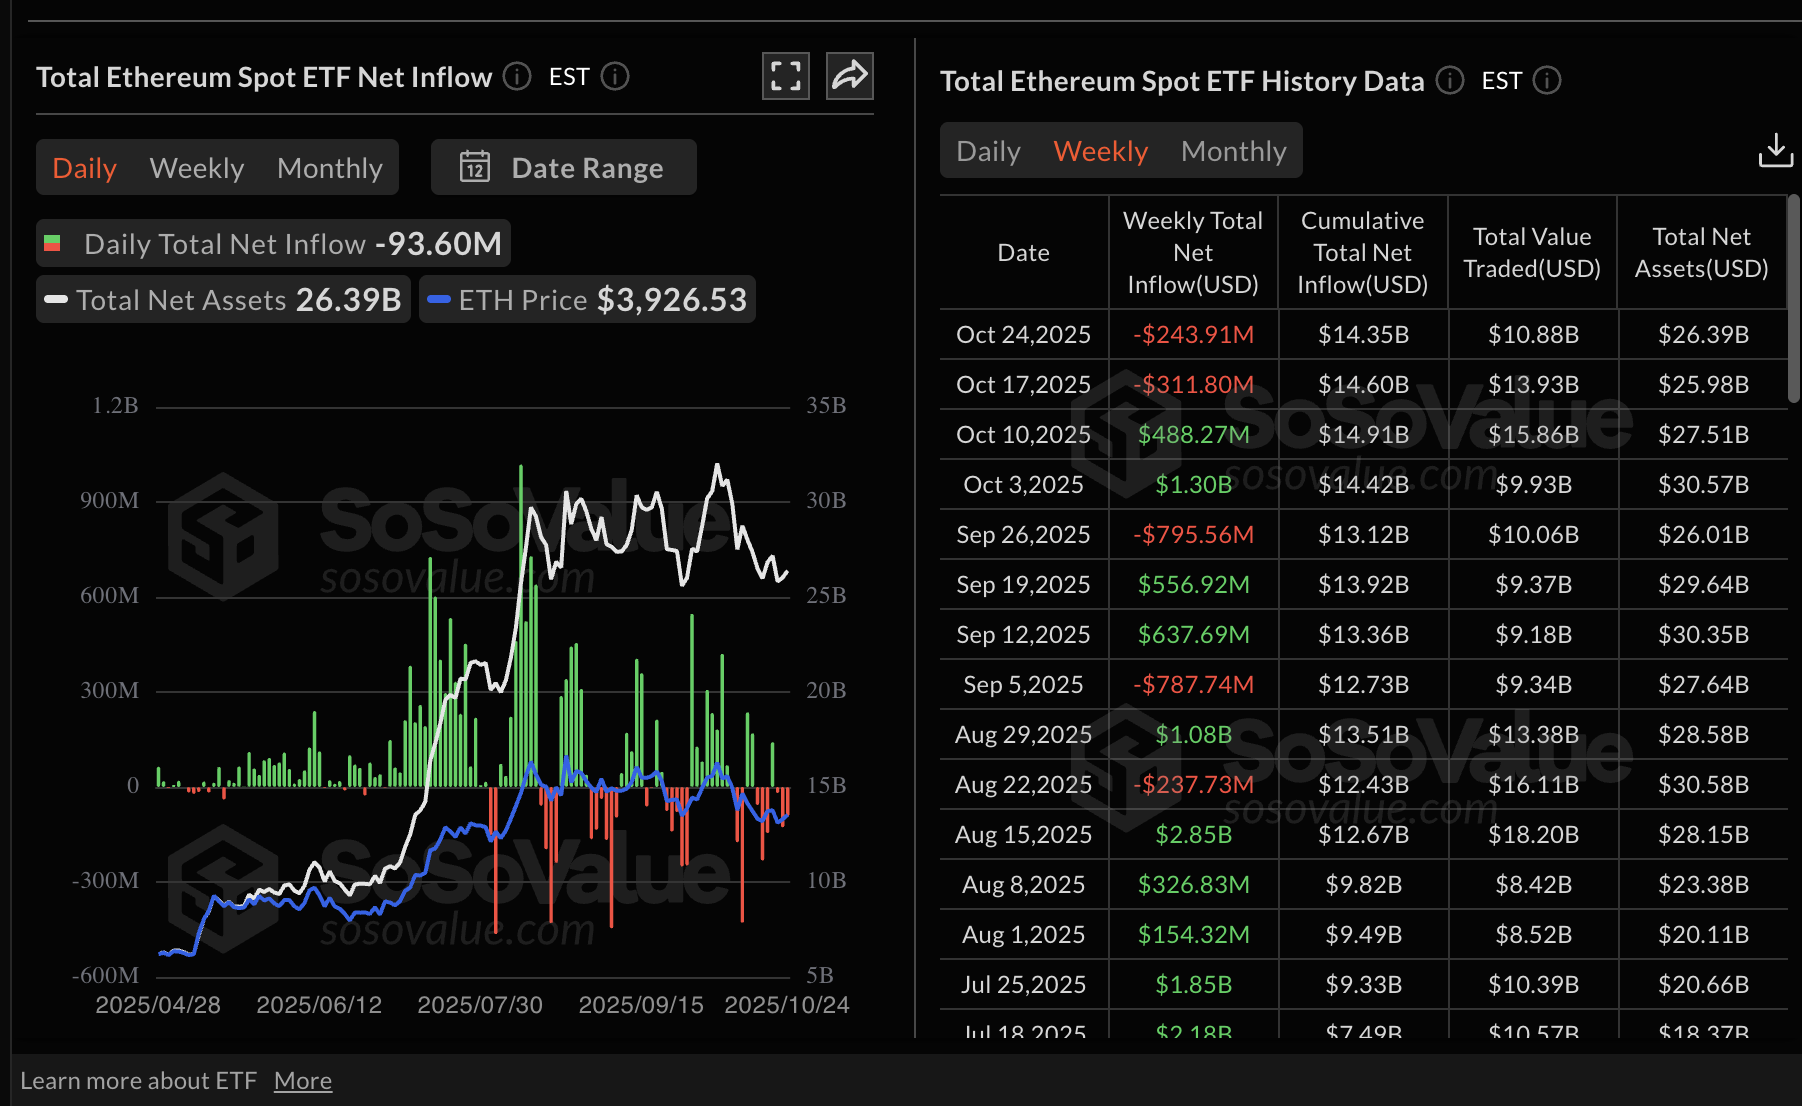
Interest in Ethereum US-listed ETFs lags Bitcoin, with net outflows of $244 million last week and $312 million the week before. According to SoSoValue data, ETH ETFs saw inflows on just one of five business days last week, suggesting risk-off sentiment among investors.
On the other hand, ETF outflows imply that investors could be realizing profits before seeking new opportunities heading into the second month of the fourth quarter.
Ethereum ETFs stats | Source: CoinGlass
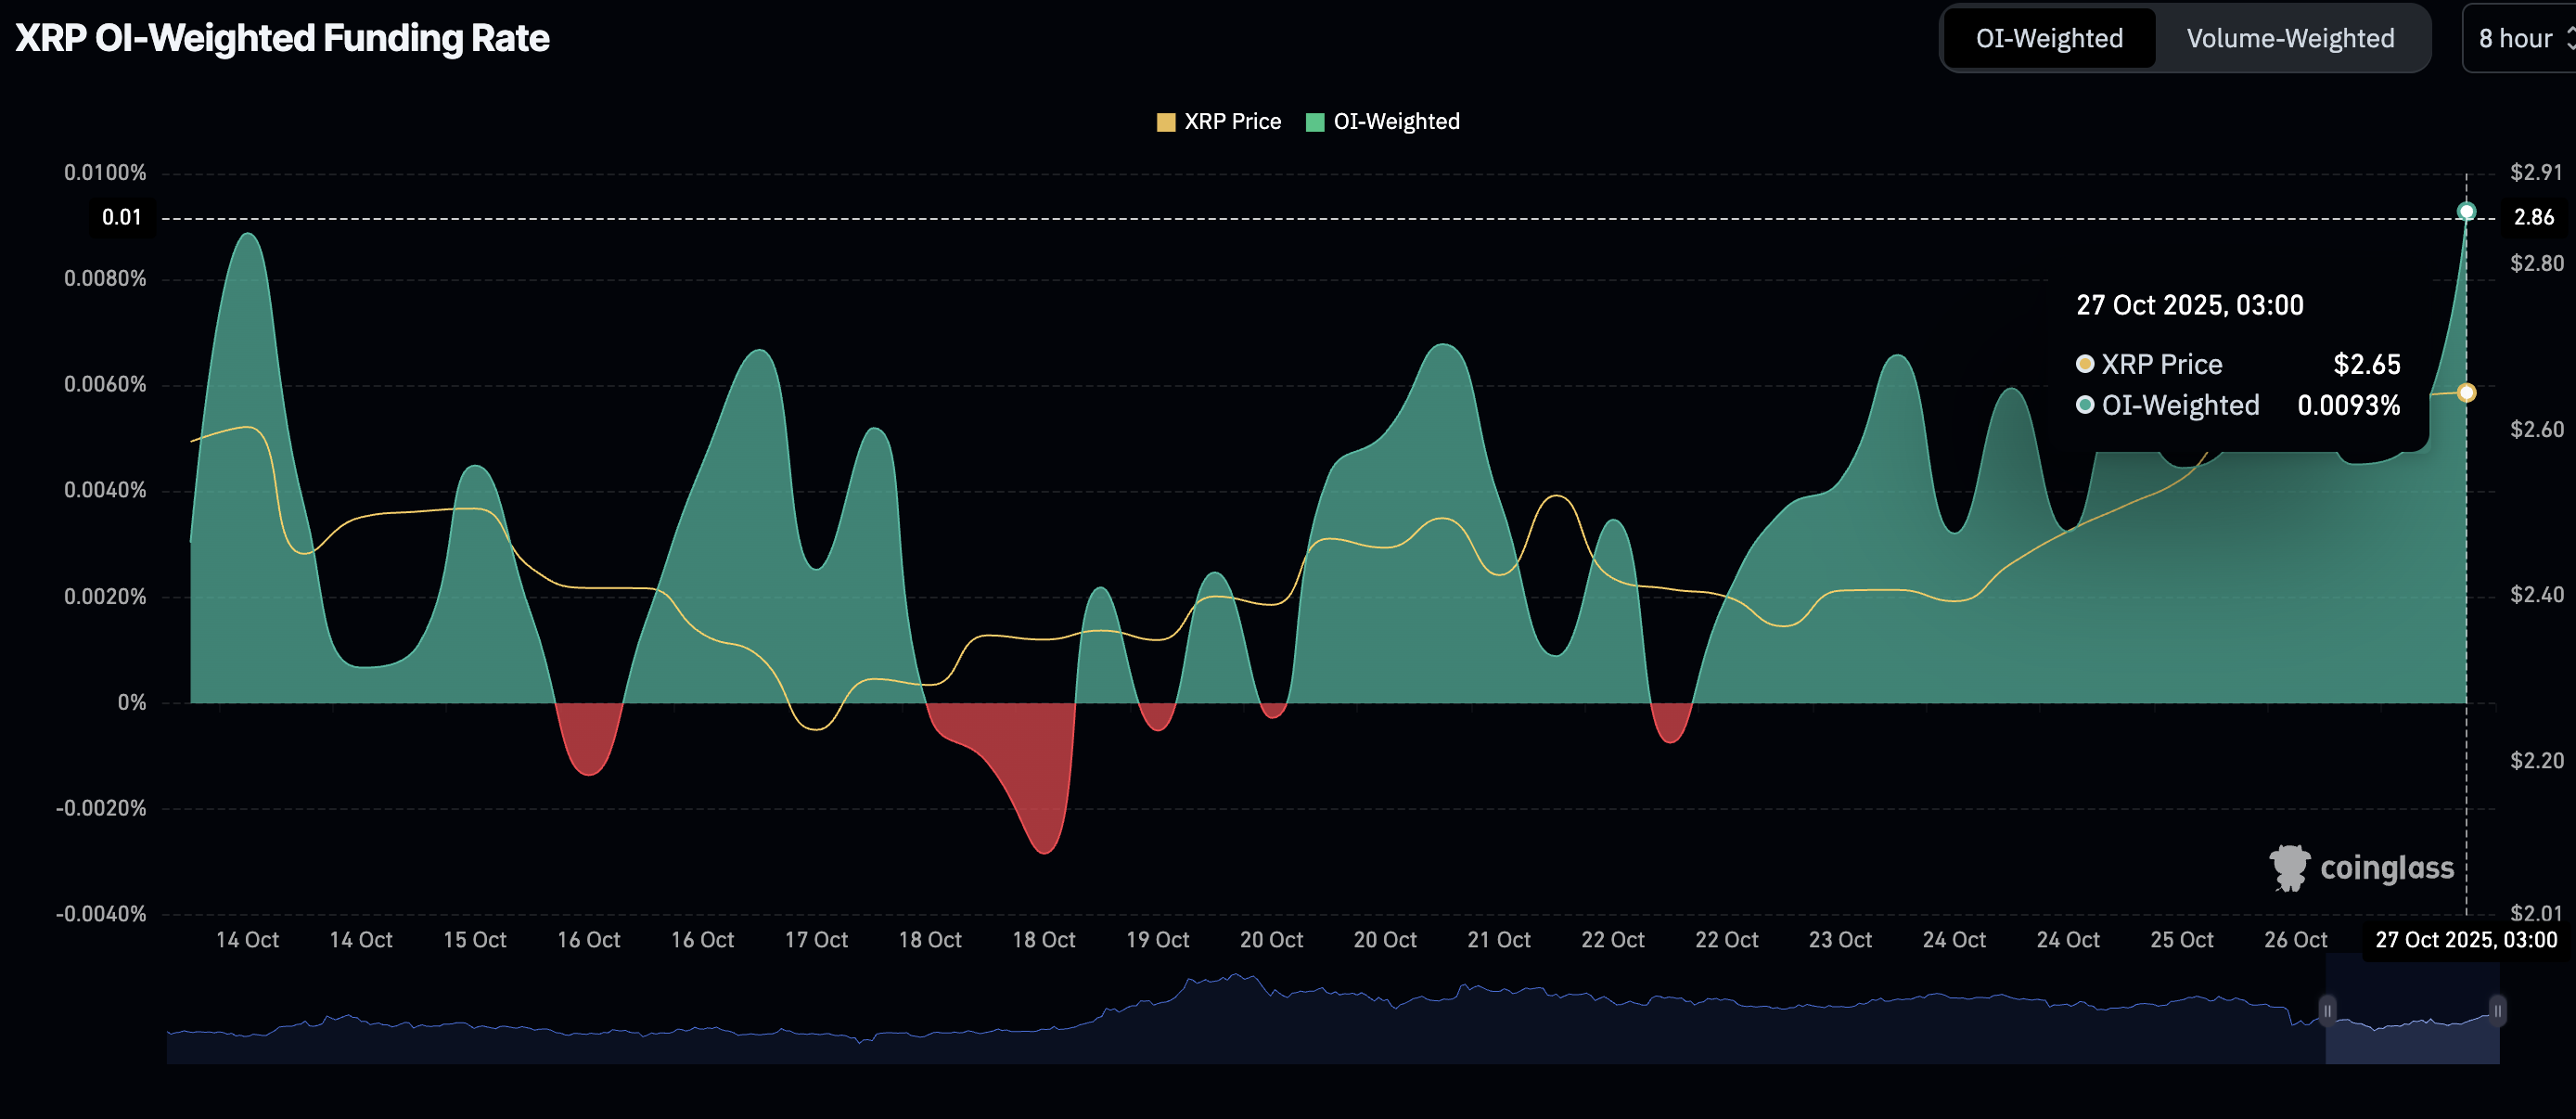
XRP, on the other hand, has seen a sharp rebound in the Open Interest weighted funding rate to 0.0093% on Monday from 0.0045% on Sunday. The OI weighted funding rate tracks the level of trader interest in XRP. A sustained increase signals that traders are confident about rejoining the market, piling into long positions, which strengthens the token's short-term bullish picture.
XRP holds above $2.61 support at the time of writing, highlighting an improving technical picture that is likely to sustain the short-term uptrend.
XRP OI-Weighted Funding Rate | Source: CoinGlass
Chart of the day: Bitcoin gains momentum
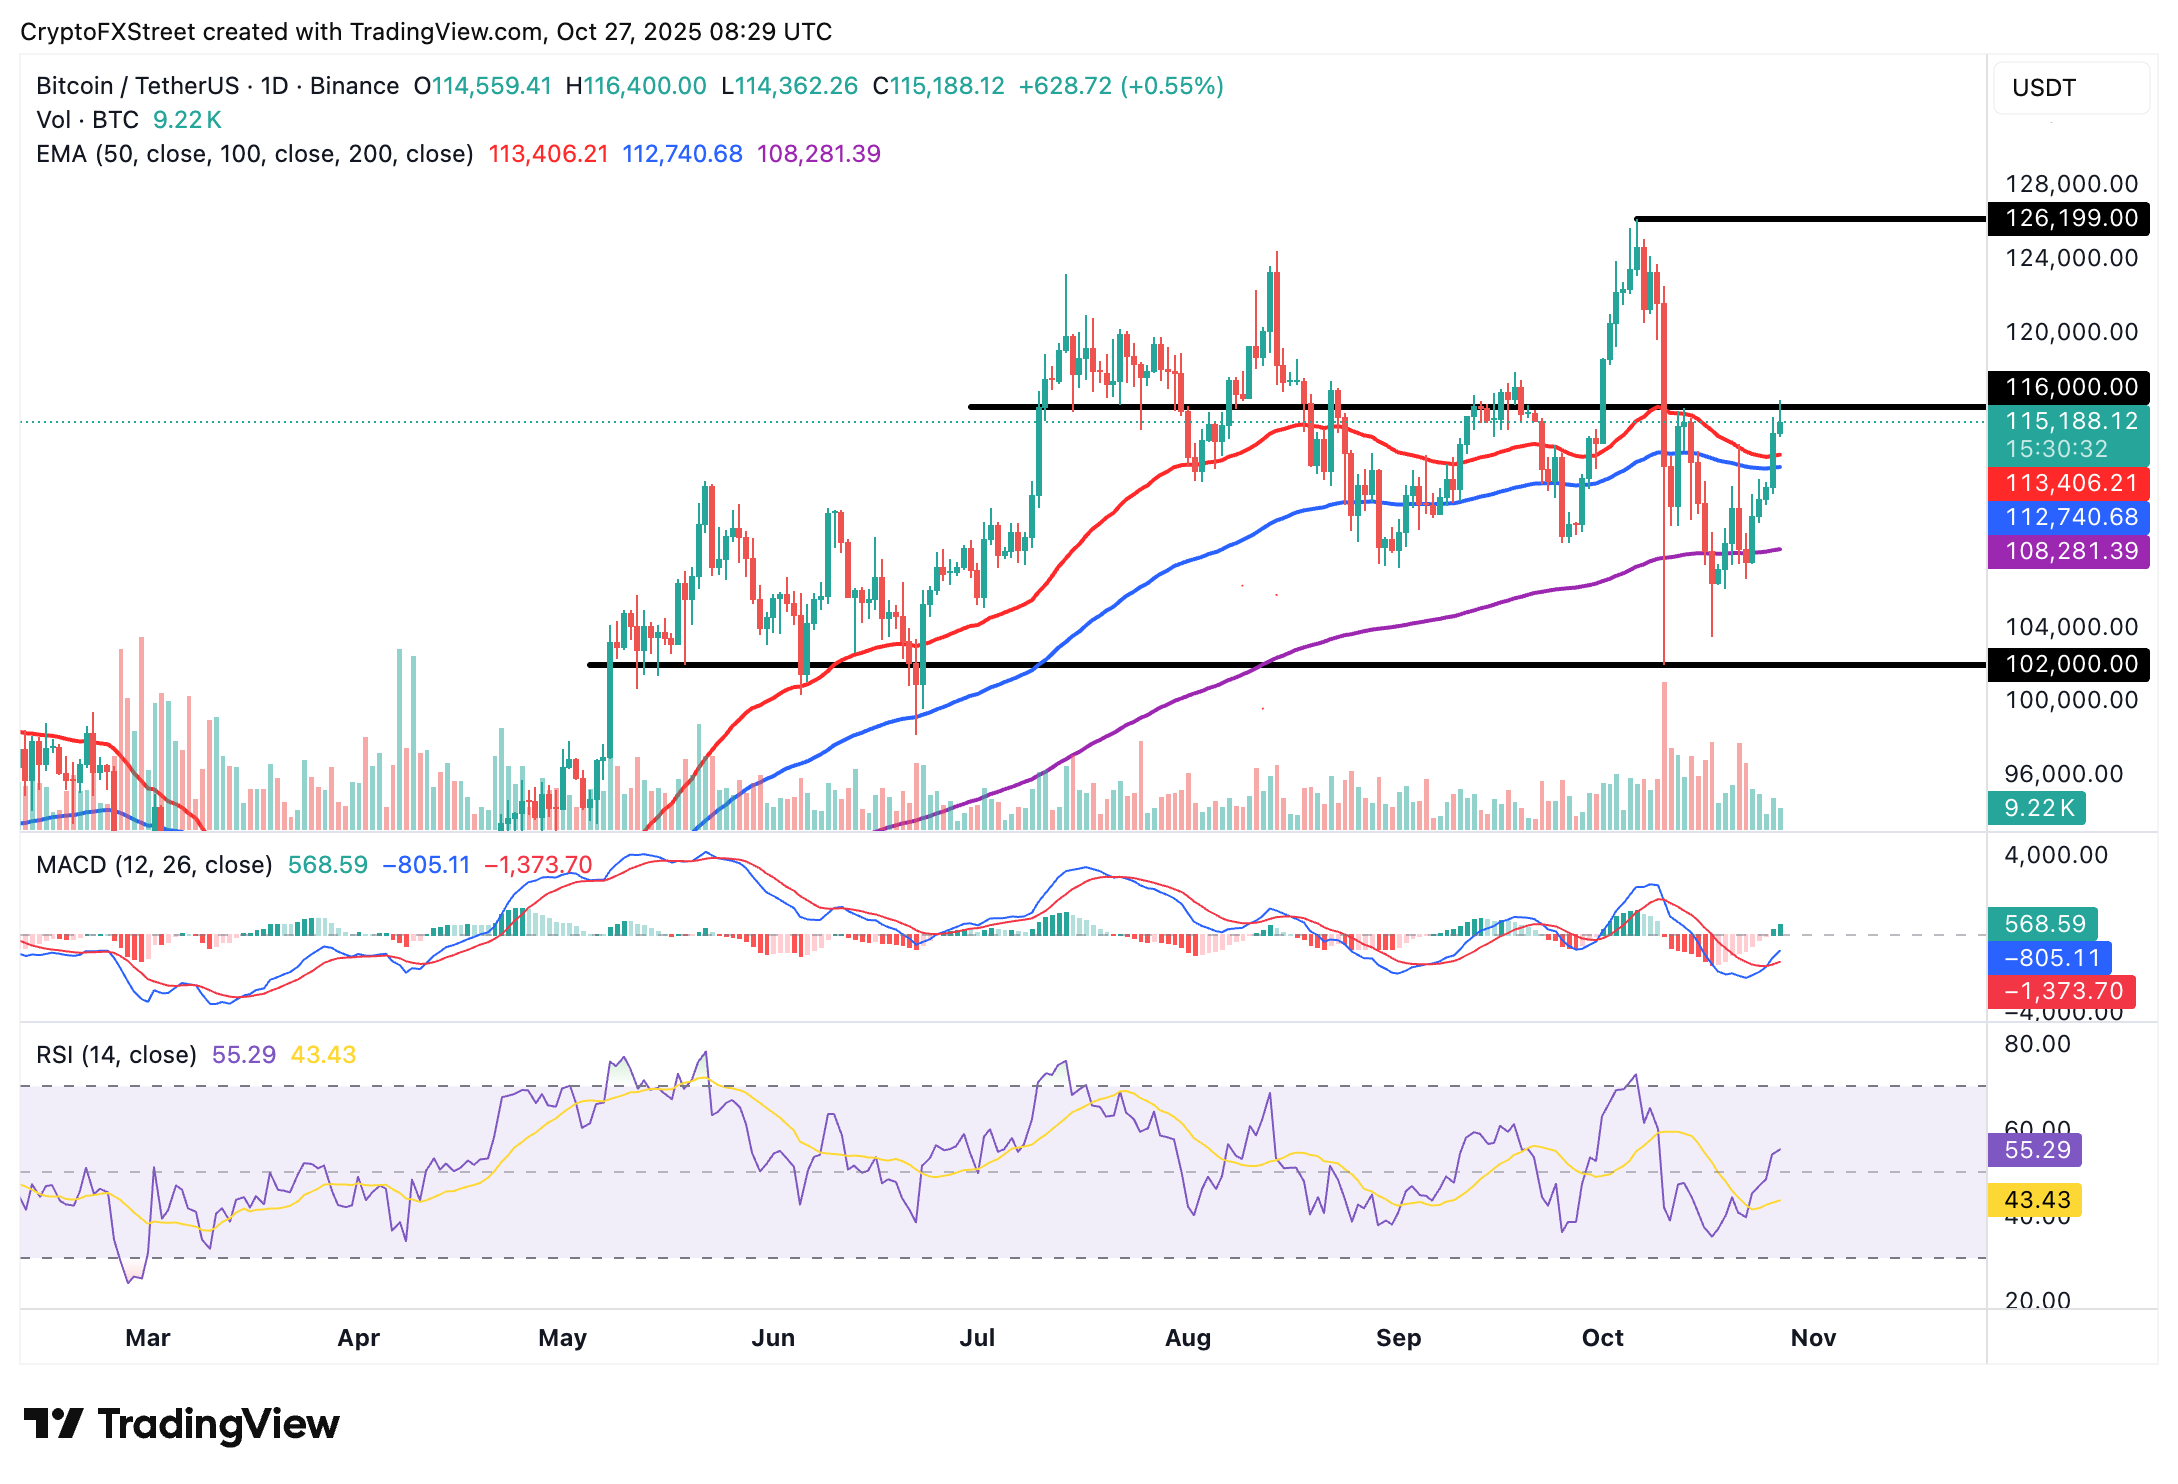
Bitcoin offers bullish signals at the time of writing on Monday after reclaiming its position above the 100-day Exponential Moving Average (EMA) at $112,740 and the 50-day EMA at $113,406 on the daily chart.
An earlier attempt to breach the $116,000 resistance failed, leading to a minor reversal toward the $115,000 level. Still, with the Moving Average Convergence Divergence (MACD) indicator upholding a buy signal on the daily chart, the path of least resistance could remain upward in the short term.
Investors often seek exposure when the MACD line in blue crosses above the red signal line, as the indicator generally rises. The expanding green histogram bars bolster the bullish outlook, accentuated by the upward-trending Relative Strength Index (RSI) at 55. Higher RSI readings near overbought territory signal increasing bullish momentum.
BTC/USDT daily chart
Key milestones for Bitcoin include a daily close above the $116,000 immediate resistance and later the $120,000 critical hurdle. If traders book early profits, the 50-day EMA at $113,406 and the 100-day EMA at $112,740 are in line to absorb overhead pressure.
Altcoins update: Ethereum, XRP bulls tighten grip
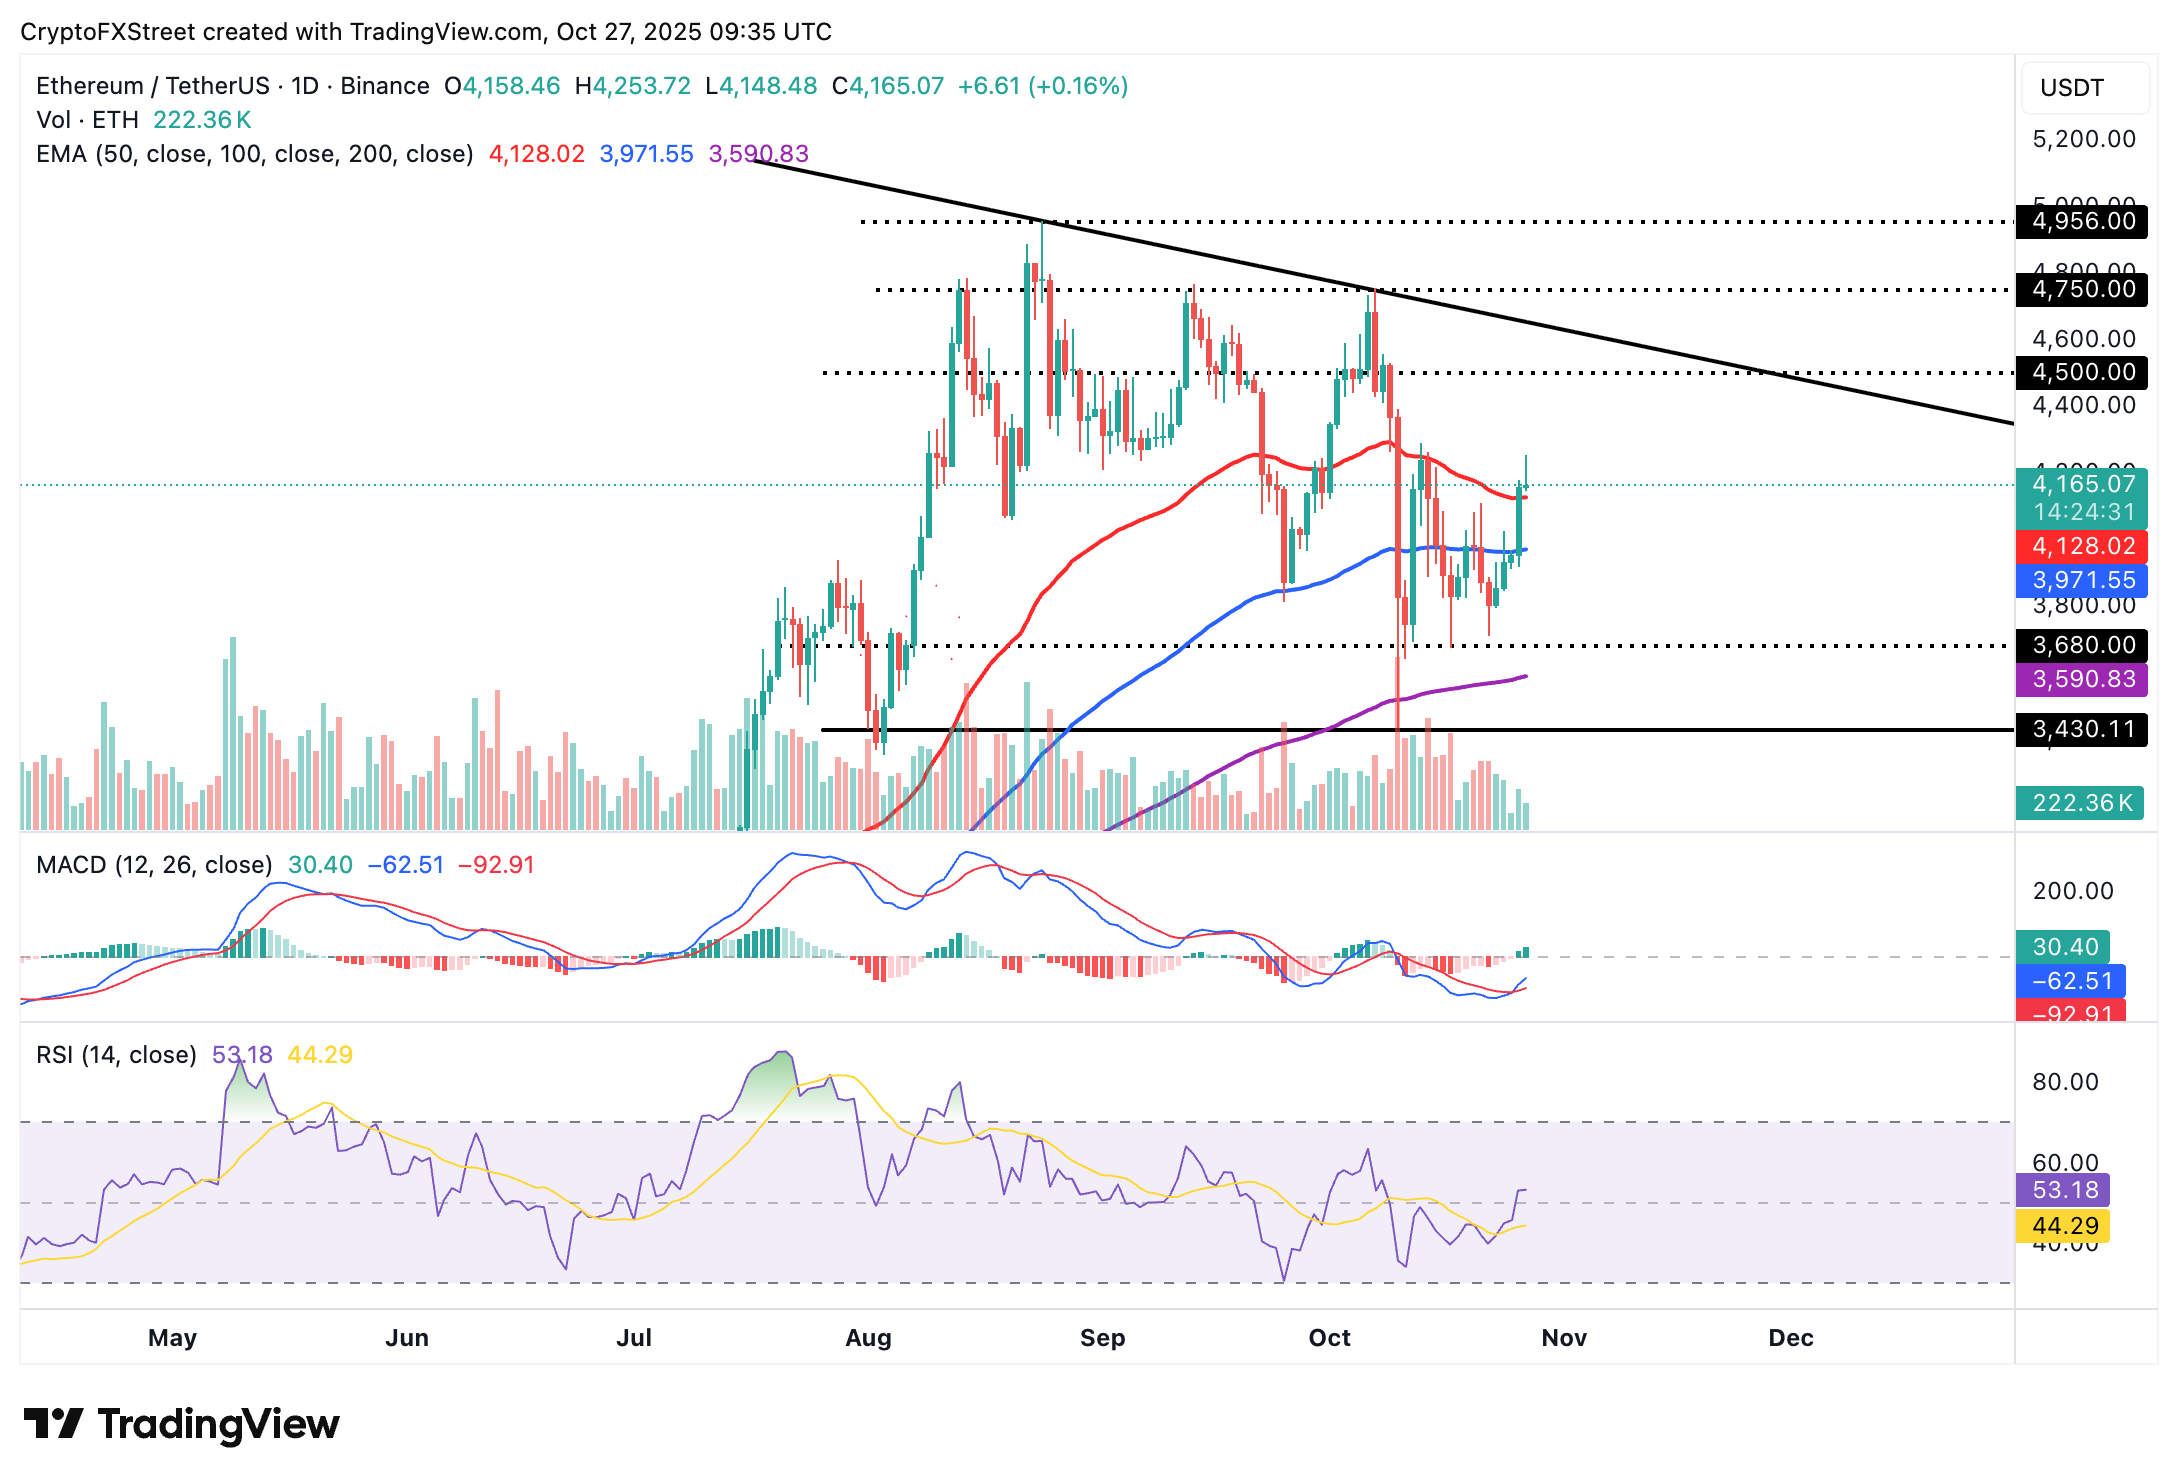
Ethereum is largely in bullish hands, holding above the 50-day EMA support at $4,128 on the daily chart. A buy signal from the MACD indicator, maintained since Sunday, supports the bullish outlook.
The steady RSI at 53 on the same daily range indicates that bulls have the upper hand. If the RSI rises toward the overbought region, the odds of Ethereum extending its up leg toward the $4,500 resistance would significantly increase.
Still, traders should be cautiously optimistic and watch for potential early profit-taking, which may dampen the uptrend. They should not lose sight of the 100-day EMA support at $3,971 and the demand zone at $3,860, both of which could absorb selling pressure and prevent Ethereum from falling to the 200-day EMA at $3,590.
ETH/USDT daily chart
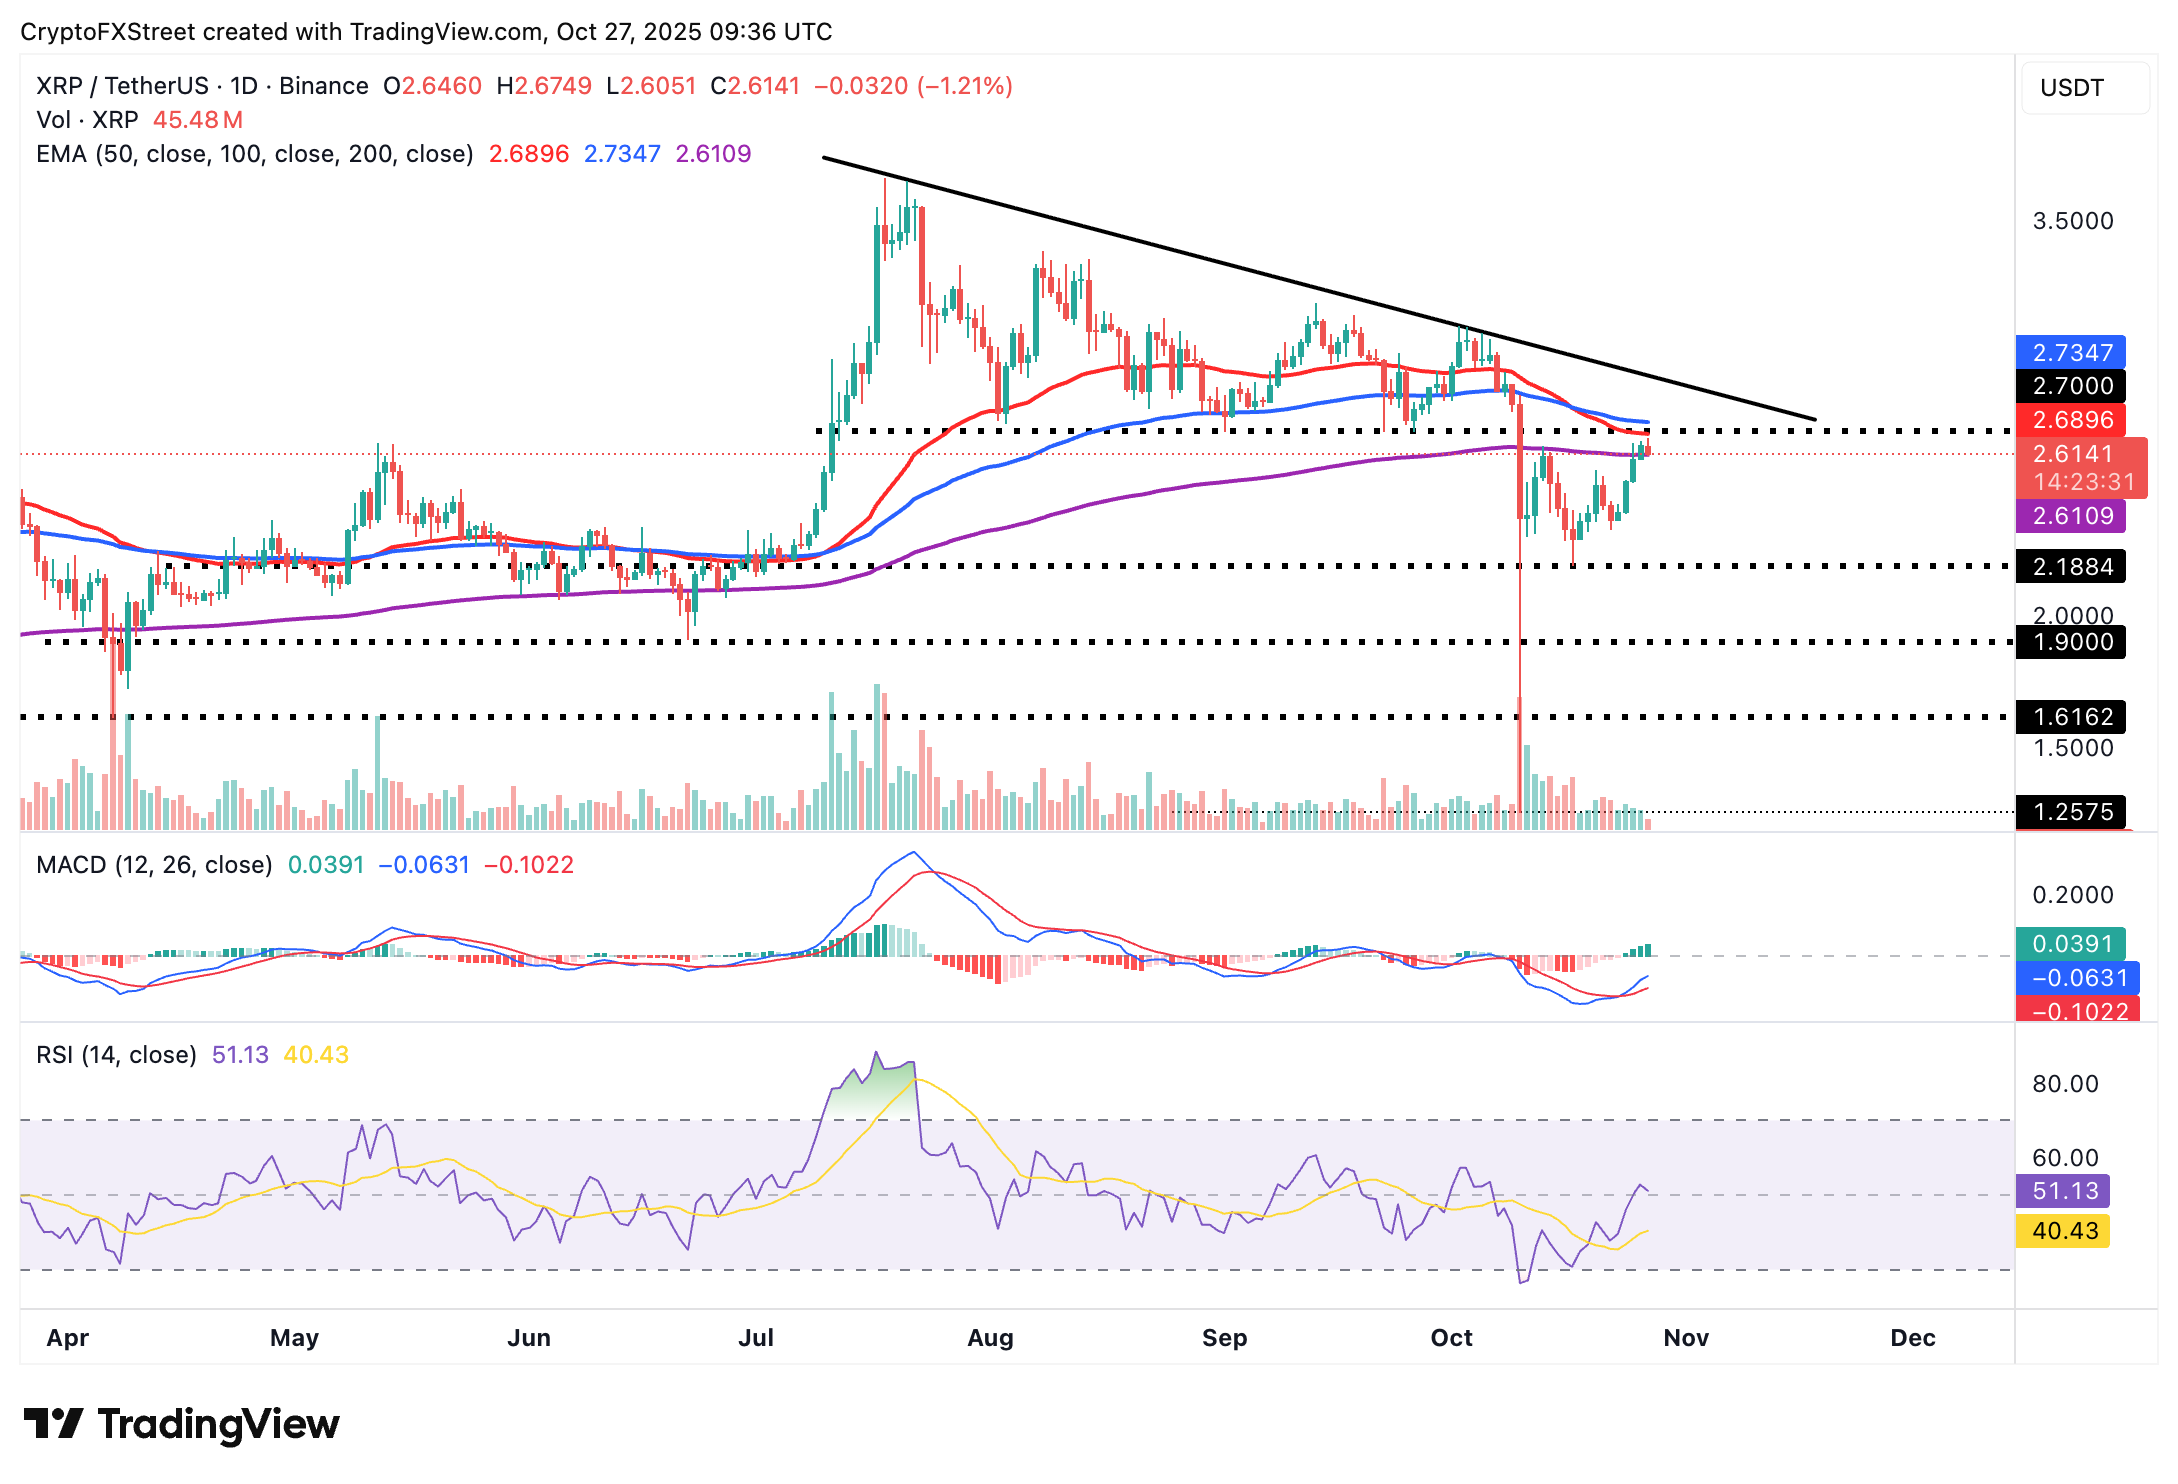
As for XRP, the 200-day EMA resistance-turned support at $2.61 anchors the cross-border remittance token. The MACD indicator reinforces XRP's short-term bullish outlook with a buy signal triggered on Friday. Traders would be inclined to increase their risk exposure if the blue MACD line remains above the red signal line, as the indicator generally rises.
XRP/USDT daily chart
Meanwhile, bulls are pushing for a daily close above the 50-day EMA at $2.68 and later the 100-day EMA at $2.73. However, short-term volatility may delay the breakout, particularly given the descending RSI at 51. A pullback below the midline would imply that bears have the upper hand, potentially accelerating a move below the immediate 200-day EMA at $2.61.
Crypto ETF FAQs
An Exchange-Traded Fund (ETF) is an investment vehicle or an index that tracks the price of an underlying asset. ETFs can not only track a single asset, but a group of assets and sectors. For example, a Bitcoin ETF tracks Bitcoin’s price. ETF is a tool used by investors to gain exposure to a certain asset.
Yes. The first Bitcoin futures ETF in the US was approved by the US Securities & Exchange Commission in October 2021. A total of seven Bitcoin futures ETFs have been approved, with more than 20 still waiting for the regulator’s permission. The SEC says that the cryptocurrency industry is new and subject to manipulation, which is why it has been delaying crypto-related futures ETFs for the last few years.
Yes. The SEC approved in January 2024 the listing and trading of several Bitcoin spot Exchange-Traded Funds, opening the door to institutional capital and mainstream investors to trade the main crypto currency. The decision was hailed by the industry as a game changer.
The main advantage of crypto ETFs is the possibility of gaining exposure to a cryptocurrency without ownership, reducing the risk and cost of holding the asset. Other pros are a lower learning curve and higher security for investors since ETFs take charge of securing the underlying asset holdings. As for the main drawbacks, the main one is that as an investor you can’t have direct ownership of the asset, or, as they say in crypto, “not your keys, not your coins.” Other disadvantages are higher costs associated with holding crypto since ETFs charge fees for active management. Finally, even though investing in ETFs reduces the risk of holding an asset, price swings in the underlying cryptocurrency are likely to be reflected in the investment vehicle too.
บทความแนะนำ


