


Bitcoin Price Forecast: BTC could retest $100,00 before resuming its upward trend
- Bitcoin price hovers near $110,600 on Thursday, testing key ascending trendline support.
- Heightened geopolitical tensions and renewed US-China trade frictions weigh on risk assets like BTC.
- Report suggests that Bitcoin may retest the $100,000 level before establishing the next major leg higher.
Bitcoin (BTC) remains pressured as it hovers near $110,600 on Thursday, testing a key ascending trendline support. The rising geopolitical tensions and renewed US-China trade frictions are weighing on investor sentiment, keeping risk appetite subdued. A Copper Research report suggests that BTC could retest the $100,000 level before regaining upward momentum.
Bitcoin consolidates as risk appetite remains subdued
Bitcoin price recovery has slowed down so far this week, as escalating geopolitical tensions between Russia and Ukraine, along with renewed US-China trade frictions, weigh on investor sentiment, leaving BTC to trade around $110,600 on Thursday.
On Wednesday, US Defense Secretary Pete Hegseth warned Russia of potential consequences for continued aggression if the war in Ukraine persists. Earlier in the week, US President Donald Trump had said that he is considering providing Ukraine with longer-range Tomahawk cruise missiles.
Meanwhile, the US-China trade tensions escalated further after both sides imposed tit-for-tat port fees this week. Adding to this, President Trump said that he was considering terminating the cooking Oil trade with China in retaliation for the latter’s refusal to purchase American soybeans.
Trump stated that he viewed the US as locked in an all-out trade war with China. However, US Treasury Secretary Scott Bessent proposed pausing import duties on Chinese goods for longer than three months if China halts its plan for strict export controls on rare-earth elements.
These ongoing geopolitical conflicts and trade tensions between the world's two largest economies have triggered uncertainty and a risk-off sentiment in the market, which doesn’t bode well for riskier asset prices such as BTC.
Why could BTC retest the $100,000 mark before the next leg higher?
A Copper Research report on Tuesday highlighted that historical patterns suggest further downside is still possible.
The report explained that Bitcoin might revisit the $100,000 level this month, potentially touching its long-term supportive zone — the 52-week average — as it has done several times in recent years, as shown in the chart below.
“Any decisive break away from this line would represent a genuine regime shift, comparable to those seen in 2014, 2018, and 2022. If historical sequencing holds, such a shift would not likely occur until 2026,” says the analyst.
-1760602861567-1760602861569.png)
Fadi Aboualfa, Head of Research at Copper, told FXStreet that, “Despite last week’s market turbulence, Bitcoin’s movement remains consistent, approaching long-term trend patterns that have compressed with the 52-week average. With strong ETF influence and supportive technical signals, a brief move towards $100k would be viewed as a healthy retest rather than a cause for concern.”
BTC funding rates plunge to 2022 FTX levels
Some signs of optimism emerge despite recent turbulence. The historic leverage flush pushed futures market stress to extremes, with funding rates plunging to levels not seen since the FTX collapse in late 2022, as shown in the graph below.
Across perpetual futures, annualized funding briefly turned sharply negative, indicating that traders were paying a premium to stay short after bullish leverage was wiped out. This marks a complete sentiment reversal, with participants rapidly de-risking amid forced liquidations.
Historically, such extreme funding resets have coincided with peak fear and the final stages of deleveraging, often cleansing excess leverage and restoring balance for a healthier recovery phase in the mid-term.
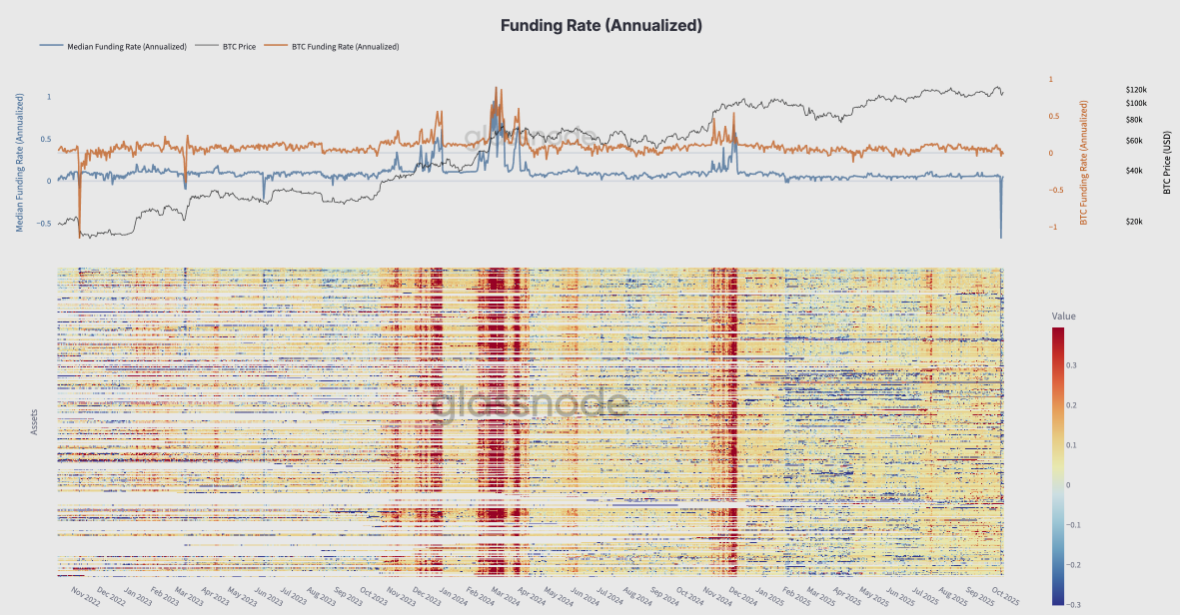
BTC funding rate chart. Source: Glassnode
Bitcoin Price Forecast: BTC momentum indicators hint at further correction
Bitcoin price faced rejection from the 50-day Exponential Moving Average (EMA) at $115,154 on Tuesday and declined by nearly 4% the next day. At the time of writing on Thursday, BTC hovers at $110,600, nearing an ascending trendline.
If BTC breaks and closes below the ascending trendline, it could extend the decline toward the daily support level at $107,245, which roughly coincides with the 200-day EMA at $108,084.
The Relative Strength Index (RSI) indicator at 40 on the daily chart suggests that bearish momentum is gaining traction. Additionally, the Moving Average Convergence Divergence (MACD) showed a bearish crossover last week, which remains in effect, further supporting the bearish view.
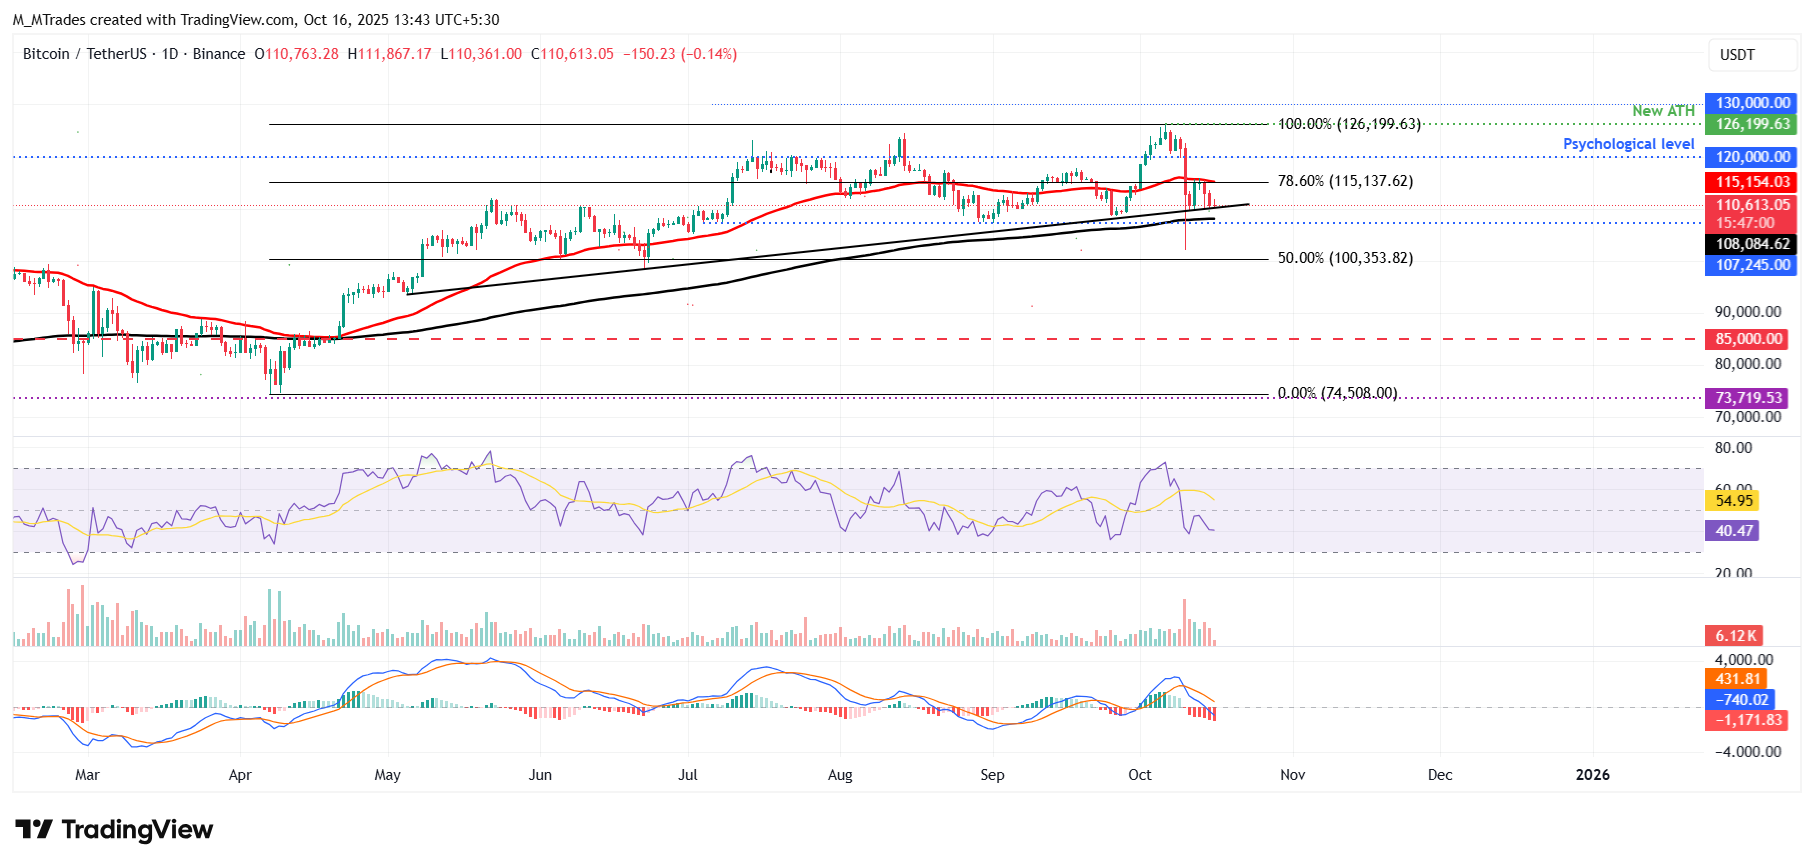
BTC/USDT daily chart
On the other side, if BTC recovers, it could extend the recovery toward the 50-day EMA at $115,154.
Bitcoin, altcoins, stablecoins FAQs
Bitcoin is the largest cryptocurrency by market capitalization, a virtual currency designed to serve as money. This form of payment cannot be controlled by any one person, group, or entity, which eliminates the need for third-party participation during financial transactions.
Altcoins are any cryptocurrency apart from Bitcoin, but some also regard Ethereum as a non-altcoin because it is from these two cryptocurrencies that forking happens. If this is true, then Litecoin is the first altcoin, forked from the Bitcoin protocol and, therefore, an “improved” version of it.
Stablecoins are cryptocurrencies designed to have a stable price, with their value backed by a reserve of the asset it represents. To achieve this, the value of any one stablecoin is pegged to a commodity or financial instrument, such as the US Dollar (USD), with its supply regulated by an algorithm or demand. The main goal of stablecoins is to provide an on/off-ramp for investors willing to trade and invest in cryptocurrencies. Stablecoins also allow investors to store value since cryptocurrencies, in general, are subject to volatility.
Bitcoin dominance is the ratio of Bitcoin's market capitalization to the total market capitalization of all cryptocurrencies combined. It provides a clear picture of Bitcoin’s interest among investors. A high BTC dominance typically happens before and during a bull run, in which investors resort to investing in relatively stable and high market capitalization cryptocurrency like Bitcoin. A drop in BTC dominance usually means that investors are moving their capital and/or profits to altcoins in a quest for higher returns, which usually triggers an explosion of altcoin rallies.
บทความแนะนำ


