


Crypto Gainers: ImmutableX hits eight-month high, Near Protocol and Avalanche rally
- ImmutableX records a double-digit rise on Friday, hitting an eight-month high.
- Near Protocol breaks out of a short-term resistance trendline, with bulls targeting $3.845.
- Avalanche rally gains momentum amid PayPal USD (PYUSD) integration.
ImmutableX (IMX), Near Protocol (NEAR), and Avalanche (AVAX) rise as top performers in the broader cryptocurrency market recovery over the last 24 hours. The technical outlook indicates further growth for top performers as trend momentum increases and the availability of further space to rise before reaching a key resistance.
ImmutableX advances a high momentum rally
IMX edges higher by 10% at press time on Friday, advancing the uptrend for the fourth consecutive day. The uptrend has surpassed the 50% retracement level of the range from the December 4 high at $2.250 to the June 22 low at $0.335, at $0.868. This breakout puts the 61.8% Fibonacci level as the immediate resistance at $1.087.
If the IMX rally surpasses this level, it could extend to the 78.6% Fibonacci retracement level at $1.497.
Adding to the bullish bias, the 50-day Exponential Moving Average (EMA) crossed above the 100-day EMA on Tuesday, signaling a Golden Cross, which indicates that the short-term growth is outpacing the prevailing trend.
More so, the technical indicators suggest that the trend momentum is heightened as the Relative Strength Index (RSI) spikes into the overbought zone at 83. At the same time, the Moving Average Convergence Divergence (MACD) and its signal line maintain a parabolic rise with rising green histogram bars.
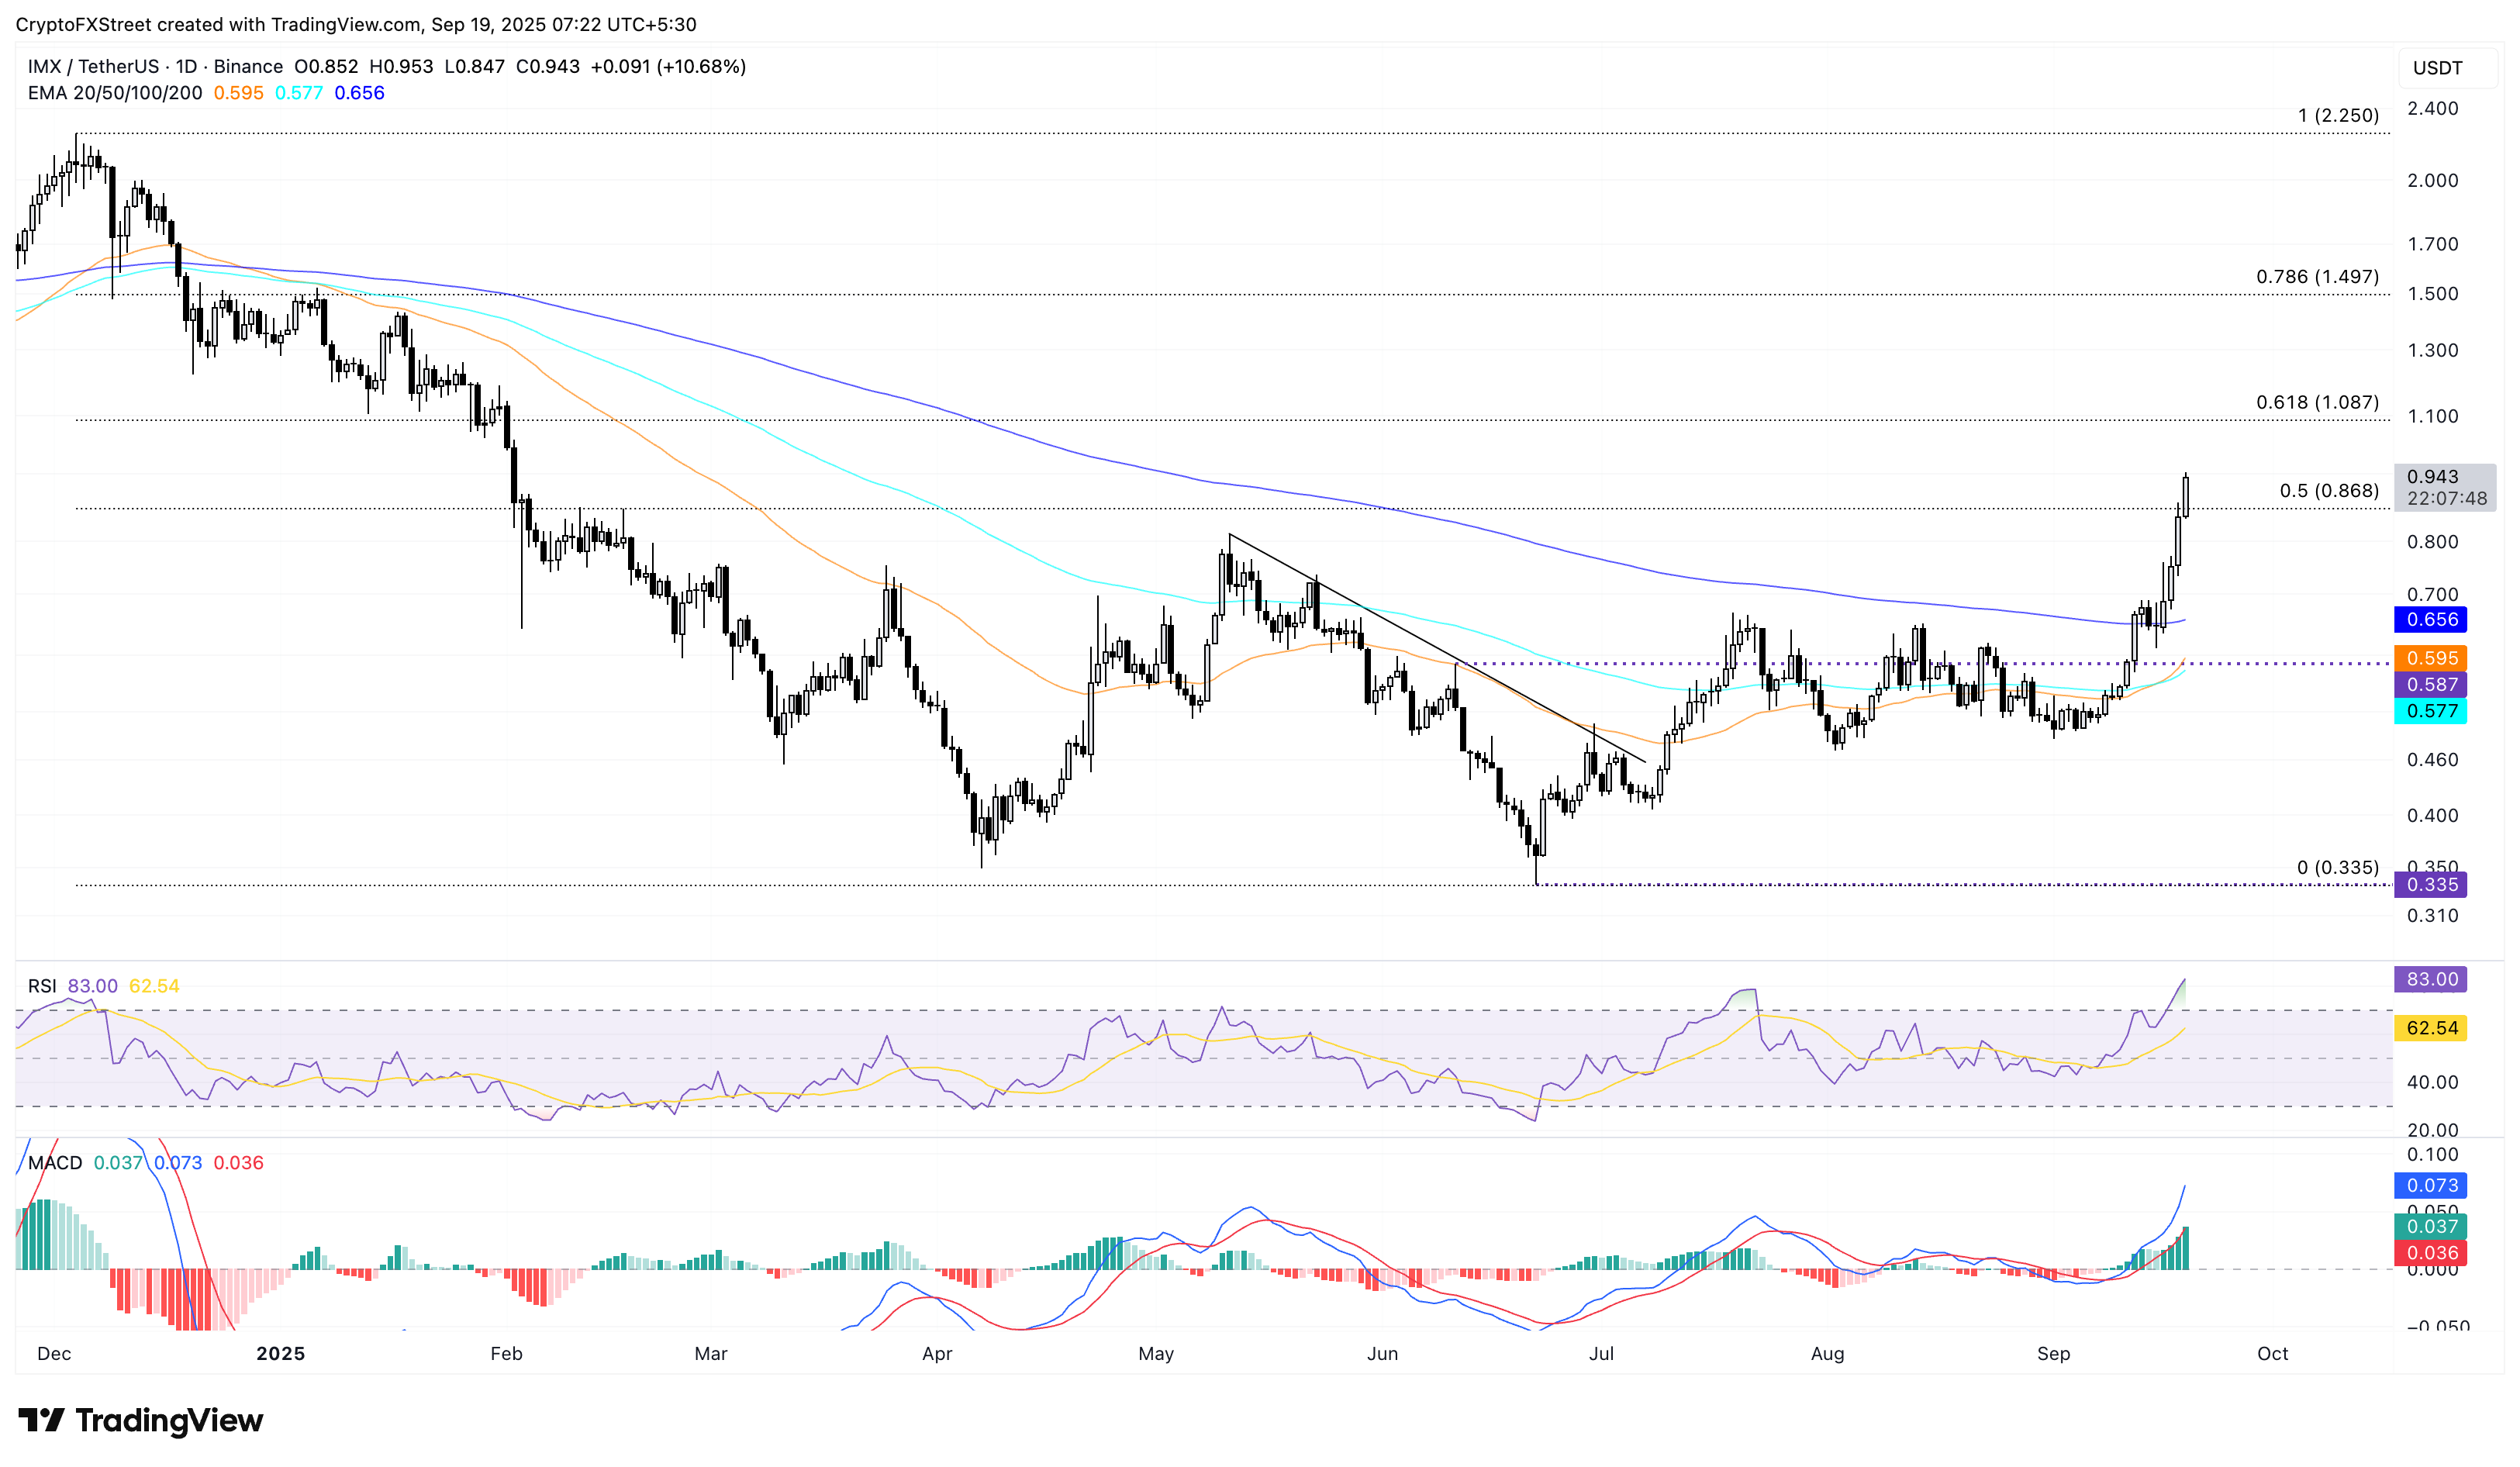
IMX/USDT daily price chart.
Looking down, if IMX fails to hold the 50% retracement level at $0.868, it could result in a pullback to the 200-day EMA at $0.656.
Near Protocol’s steady rise targets $3.845
Near Protocol holds a steady uptrend crossing above the 200-day EMA at $2.861 and a local resistance trendline, which was formed by connecting the May 10 and July 21 peaks. At the time of writing, NEAR edges higher by over 1% on Friday, advancing the 12% gains from the previous day.
The uptrend targets the 50% retracement level, drawn from the $8.244 high of December 6 to the $1.793 low of June 22, at $3.845. This presents the possibility of nearly 20% upside potential for NEAR.
Apart from the breakout, the technical indicators on the daily chart indicate a bullish bias as the RSI enters the overbought zone at 72 and the uptrend in the MACD and its signal line holds steady.
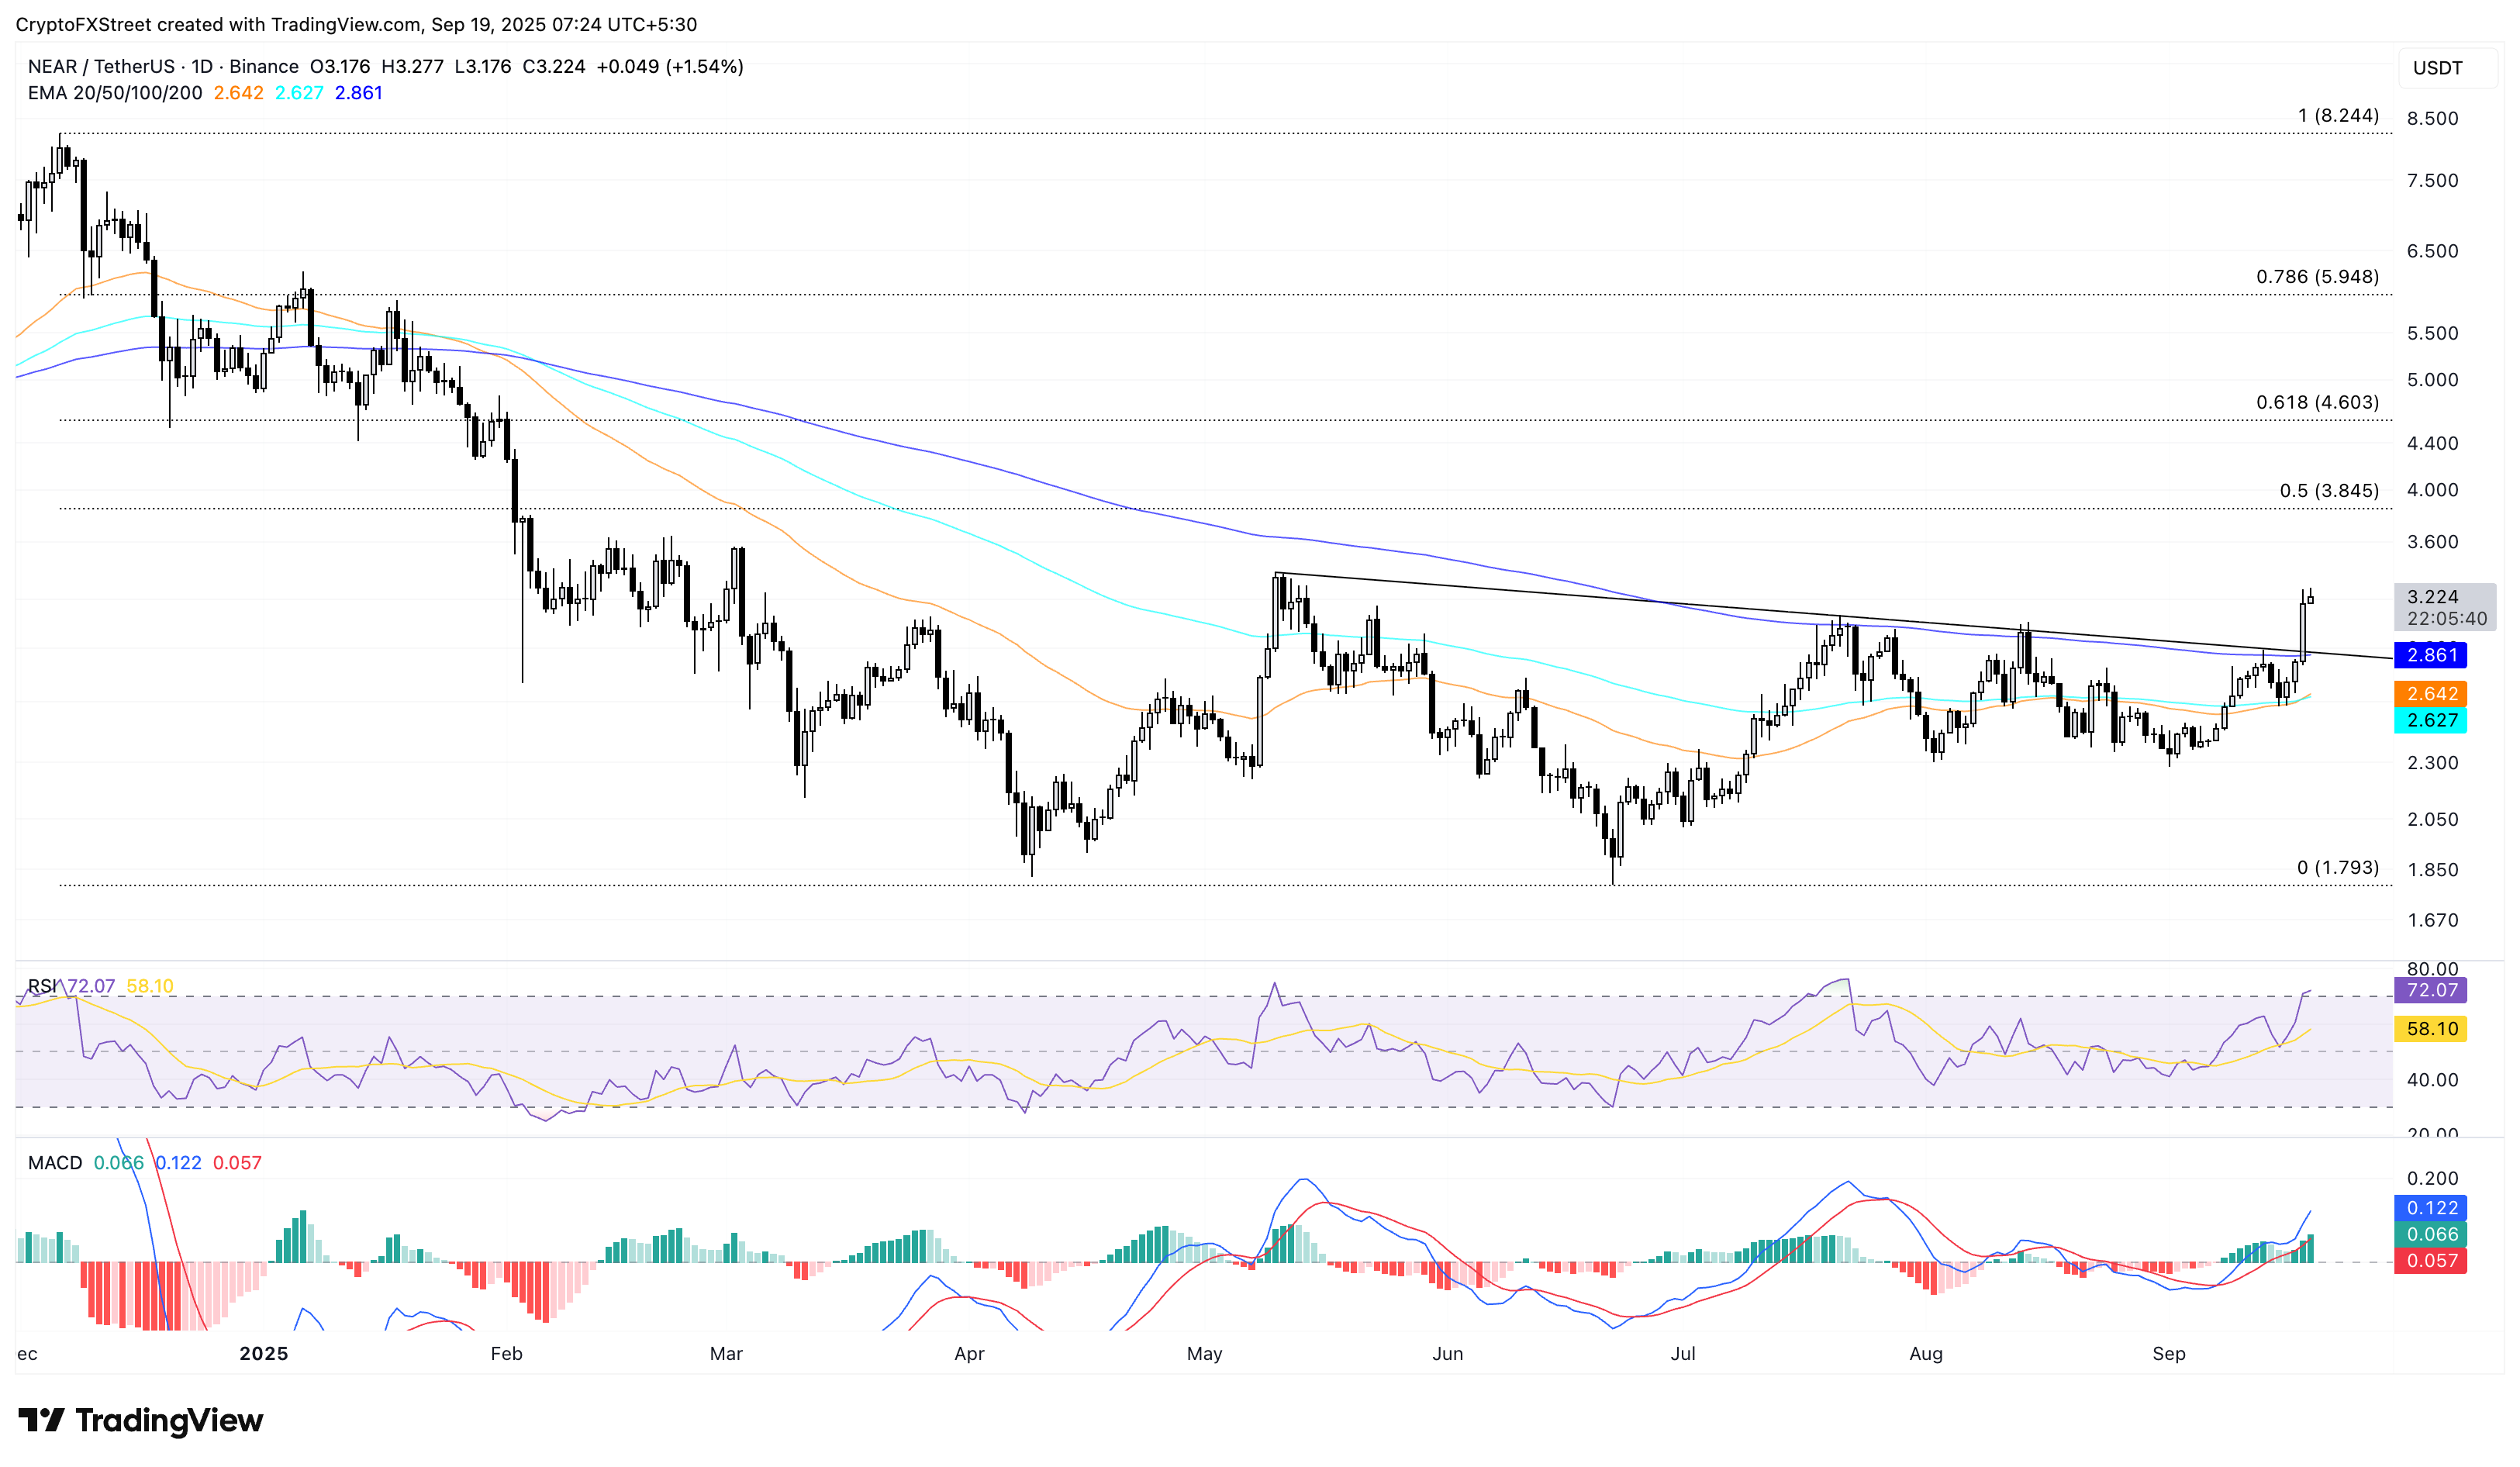
NEAR/USDT daily price chart.
On the contrary, if NEAR pulls back under the 200-day EMA, it would invalidate the breakout rally, potentially extending a decline to the 50-day EMA at $2.642.
Avalanche integrates PayPal’s PYUSD, gains bullish momentum
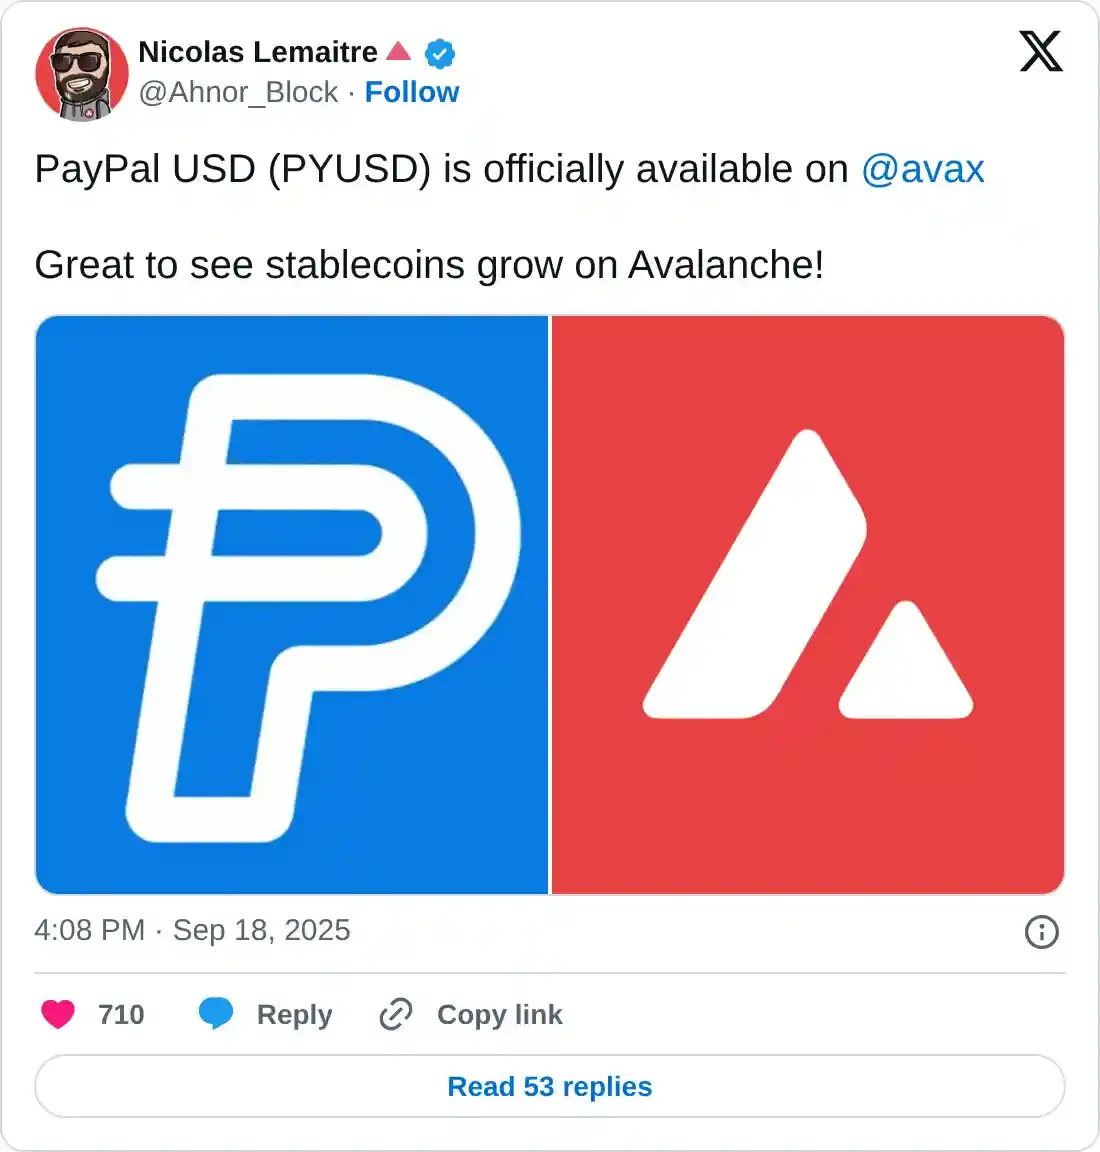
Avalanche edges higher by 1% at press time on Friday, adding gains over the 10% rise from Thursday. The AVAX rally advances for the fourth straight day as the Avalanche blockchain officially integrates PayPal’s USD stablecoin PYUSD. This integration is expected to increase the user base and liquidity of Avalanche, which could boost the demand for its native token, AVAX.
The uptrend has surpassed the 61.8% Fibonacci retracement level at $33.48, which is based on the range from the $55.79 high of December 4 to the $14.66 low of April 7. The AVAX rally targets the 78.6% Fibonacci retracement level at $41.91 as the immediate resistance, suggesting further space for growth.
Apart from the price action, Avalanche is gaining momentum as the RSI crosses into the overbought zone at 79. Additionally, the MACD indicator displays a successive rise in green histogram bars with a steady upward trend in the average lines.
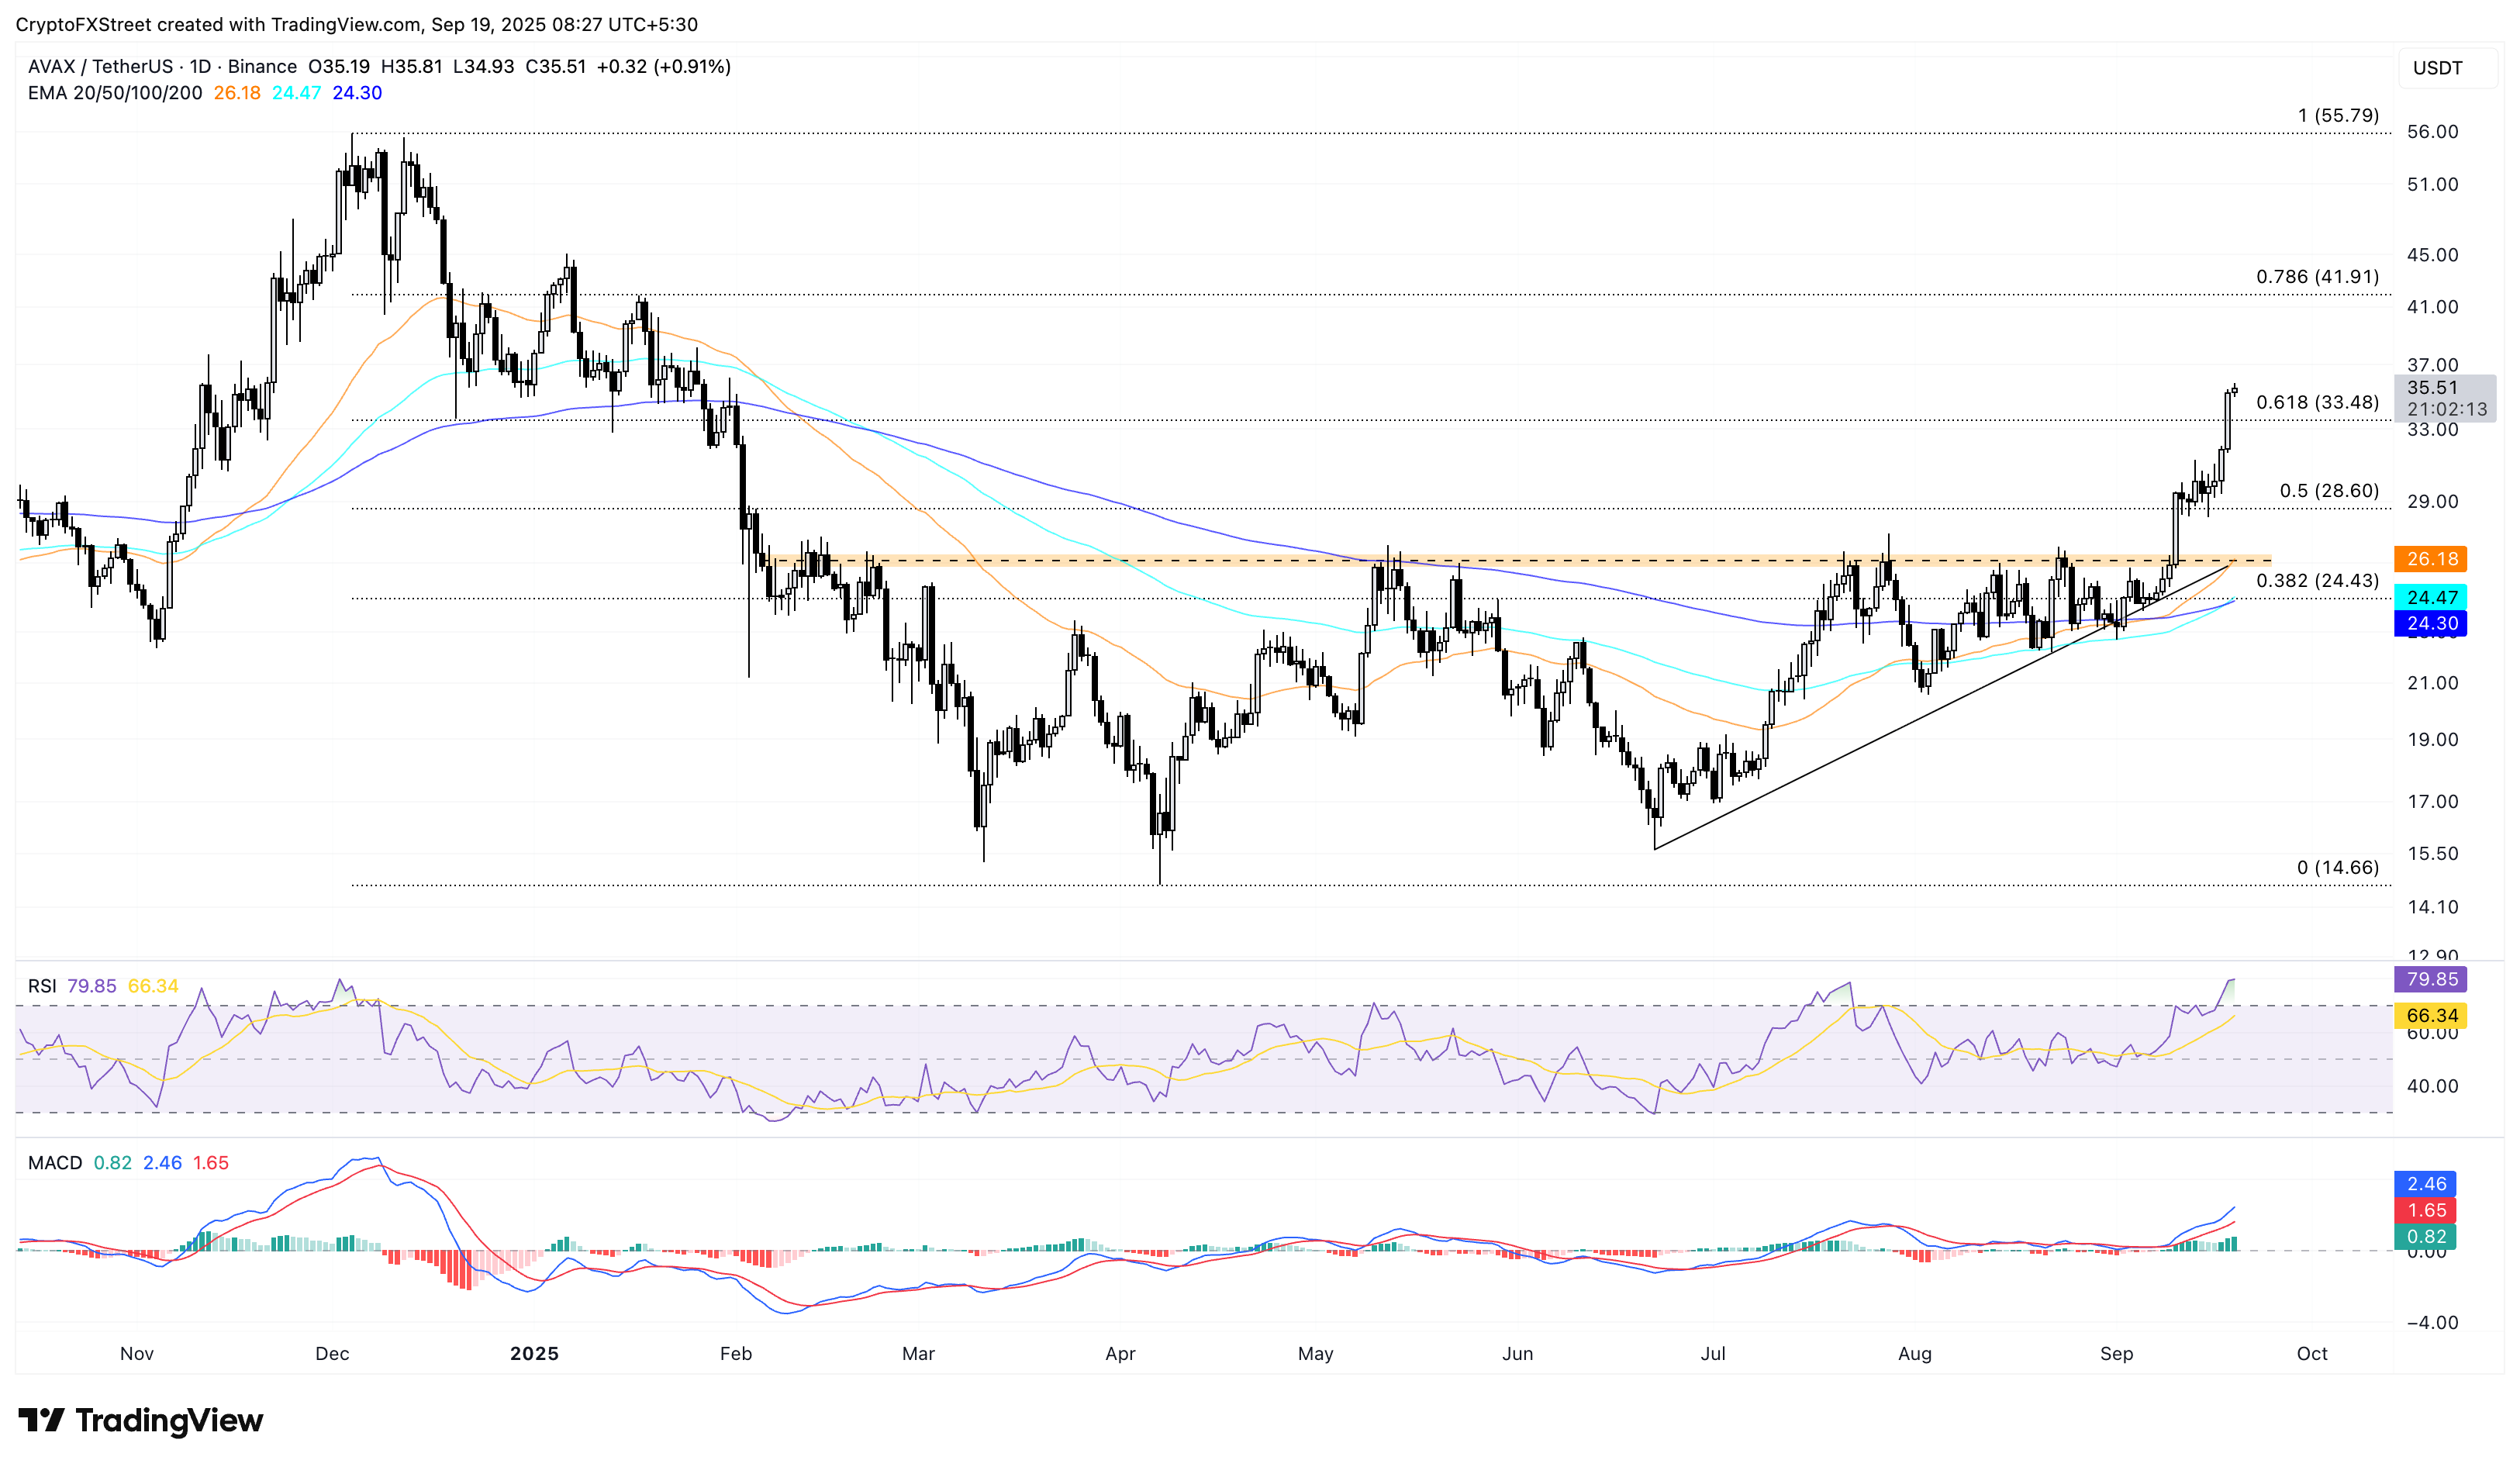
AVAX/USDT daily price chart.
On the downside, if AVAX drops below $33.48, it could extend the decline to the 50% retracement level at $28.60.
บทความแนะนำ


