


US Dollar climbs on Trump tariffs, lifting DXY amid rising risk aversion
- The US Dollar gains strength on Friday, lifted by US President Trump’s renewed tariff threats and fading expectations of near-term Fed interest rate cuts.
- Trump targets Canada with a 35% tariff, citing fentanyl concerns and trade imbalances.
- The DXY hovers below key resistance at 97.80–98.00, with price supported by the 9-day EMA at 97.50
The US Dollar gains strength on Friday, supported by renewed tariff threats from US President Donald Trump, which have reignited global trade tensions and sparked a new wave of risk aversion. As tensions escalate, investors are becoming increasingly cautious, favoring the Greenback's status as a safe haven. This shift in sentiment has driven the US Dollar Index (DXY) higher, as markets prepare for potential monetary policy changes.
The US Dollar Index (DXY), which measures the value of the Greenback against a basket of major currencies, is rising ahead of the American session. As of now, the index is trading near 97.84, up around 0.20% on the day, though it faces a confluence of key technical barriers.
US President Donald Trump has escalated tariff tensions this week by sending warning letters to more than 20 countries, including major trading partners such as Canada, Japan and South Korea, as well as threatening smaller economies with tariffs ranging from 15% to as high as 50%, based on each country's trade relationship with the United States (US). The letters, shared on Trump’s social media platform Truth Social, reflect his tough stance on trade and are a warning that the US will impose broad “reciprocal” tariffs unless trading partners agree to more favorable terms.
As part of the latest push, Trump announced a 35% tariff on Canadian imports, effective on August 1. In an official letter to Canadian Prime Minister Mark Carney, the American president cited Canada’s alleged failure to prevent the flow of fentanyl into the US, as well as long-standing trade imbalances and high tariffs on US dairy exports. The document warned that any retaliatory tariffs imposed by Canada would be met with equivalent additional levies, in addition to the 35%. Trump also emphasized that goods transshipped through Canada to bypass the duties would be subject to the higher rate, unless they are manufactured within the US.
Additionally, the US president has signaled that all remaining trading partners who have not yet received specific tariff letters or finalized trade agreements will be hit with blanket tariffs of 15% or 20%. Trump also added some countries might be excused if they agree to better deals. Economists warn that such sweeping measures could increase import costs, stoke inflation and provoke retaliatory actions, making global trade negotiations more fraught in the months ahead.
Market Movers: Treasury Yields steady, Fed cautious on tariff fallout
- USD/CAD rallied by nearly 0.5% to a high of 1.3731 before easing below the 1.3700 mark, following President Trump’s announcement of new tariffs on Canadian imports. A US official later clarified that the 35% tariffs will apply only to goods not covered under the United States-Mexico-Canada Agreement (USMCA). The latest tariff move appears to be a strategic pressure tactic aimed at pushing Canada toward finalizing a revised trade deal with the US ahead of the July 21 deadline. This deadline was set by Canadian Prime Minister Mark Carney after a meeting with Trump at the G7 Summit in Canada in mid-June. It was framed as a 30-day timeline to negotiate a new economic and security relationship.
- The yield on the 10-year US Treasury note stabilized around 4.36% on Friday, capping a volatile week marked by heightened trade tensions and shifting expectations around Federal Reserve monetary policy. Investor sentiment remained cautious, with Treasury-focused ETFs seeing a sharp rise in inflows, signaling increased demand for safe-haven assets. The firming in long-term yields reflects a guarded economic outlook and may play a key role in shaping the near-term direction of the US Dollar.
- With expectations of Federal Reserve (Fed) interest rate cuts fading, the US Dollar continues to draw support, bolstered further by recent signs of strength in the US labor market. Weekly Initial Jobless Claims came in below expectations for the third consecutive week, reinforcing the view that the economy remains resilient.
- Speaking on Thursday, Fed officials suggested that new tariffs may not lead to a sharp rise in consumer prices. San Francisco Fed President Mary Daly noted that tariffs "just don’t materialize to a large increase in price inflation for consumers because the businesses find ways to adjust.” Echoing this view, Chicago Fed President Austan Goolsbee said the impact on inflation has so far been “surprisingly little,” indicating that pricing pressures may remain contained even as trade tensions escalate.
- Also on Thursday, Fed Governor Christopher Waller reaffirmed his support for a July rate cut, stating that “inflation has come down far enough to justify a move – and tariffs should not necessarily be a reason to delay.” Meanwhile, St. Louis Fed President Alberto Musalem said, “It’s going to take time for the tariffs to settle. We could be in Q4 this year, or Q1 or Q2 of next year, where tariffs are still working themselves into the economy.”
- Overall, the solid US economic backdrop gives the Fed time to assess the impact of recent tariff announcements on inflation and growth before proceeding with further rate cuts. According to the CME FedWatch Tool, markets are pricing in only a 6.7% chance of a 25-basis-point interest rate cut in July, a 62.2% probability of a cut in September, factoring in approximately 100 basis points of total easing over the next 12 months.
Technical Analysis: US Dollar Index consolidates below 98.00, technical breakout looms
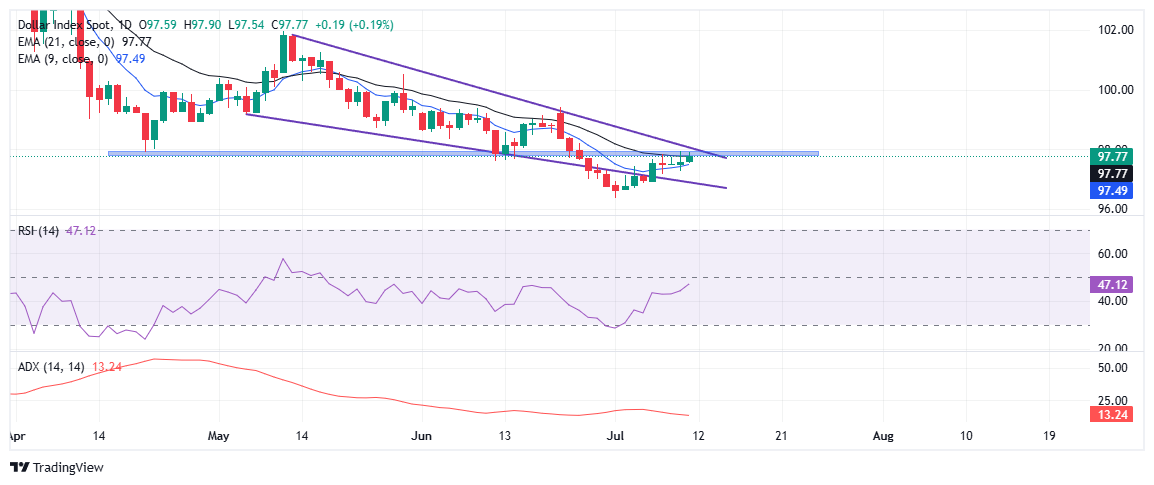
The US Dollar Index (DXY) is trading near 97.84 on Friday, with modest gains as it approaches a key technical zone. The index is hovering just below the 21-day Exponential Moving Average (EMA), currently at 97.77, which aligns with the upper boundary of a falling wedge pattern and the 97.80-98.00 zone — a former support area now acting as resistance. This confluence forms a crucial short-term barrier. A decisive break above this level could confirm a bullish reversal, opening the door toward 98.50, near the June 24 high.
On the downside, the 9-day EMA is acting as short-term dynamic support near 97.50, helping to cushion recent pullbacks. This level has consistently held over the three days, limiting downside pressure as the US Dollar consolidates within a tightening range.
Momentum indicators are showing early signs of recovery, with the Relative Strength Index (RSI) climbing to 47.12, though still below the neutral 50 level, suggesting momentum remains in development. The Average Directional Index (ADX) at 13.2 reflects a weak overall trend, indicating that a clear directional breakout has yet to materialize. While the broader setup appears cautiously constructive, bulls need a strong daily close above 98.00 to confirm sustained upside potential.
US Dollar PRICE Today
The table below shows the percentage change of US Dollar (USD) against listed major currencies today. US Dollar was the strongest against the Japanese Yen.
| USD | EUR | GBP | JPY | CAD | AUD | NZD | CHF | |
|---|---|---|---|---|---|---|---|---|
| USD | 0.13% | 0.55% | 0.56% | 0.31% | 0.17% | 0.46% | -0.04% | |
| EUR | -0.13% | 0.41% | 0.45% | 0.17% | 0.12% | 0.31% | -0.16% | |
| GBP | -0.55% | -0.41% | 0.04% | -0.25% | -0.29% | -0.02% | -0.60% | |
| JPY | -0.56% | -0.45% | -0.04% | -0.24% | -0.39% | -0.13% | -0.62% | |
| CAD | -0.31% | -0.17% | 0.25% | 0.24% | -0.08% | 0.13% | -0.36% | |
| AUD | -0.17% | -0.12% | 0.29% | 0.39% | 0.08% | 0.35% | -0.29% | |
| NZD | -0.46% | -0.31% | 0.02% | 0.13% | -0.13% | -0.35% | -0.54% | |
| CHF | 0.04% | 0.16% | 0.60% | 0.62% | 0.36% | 0.29% | 0.54% |
The heat map shows percentage changes of major currencies against each other. The base currency is picked from the left column, while the quote currency is picked from the top row. For example, if you pick the US Dollar from the left column and move along the horizontal line to the Japanese Yen, the percentage change displayed in the box will represent USD (base)/JPY (quote).
추천 기사


