

US Dollar steady as markets try to read through tariffs and US data
- The US Dollar trades broadly stable as traders assess the recent Dallas Fed Manufacturing Survey.
- The Trump administration shelves negotiation attempts with China while more reprieve on US tariffs could be announced.
- The US Dollar Index is still capped below the 100.00 round level, trading near 99.20 on Tuesday.
The US Dollar Index (DXY), which tracks the performance of the US Dollar (USD) against six major currencies, edges slightly higher and trades at 99.20 at the time of writing on Tuesday. The dust is still settling after the Dallas Federal Reserve (Fed) released the April Manufacturing Sentiment Index on Monday. Besides the fact that the number contracted to -35.8, a number not seen since the COVID pandemic, the actual report mentioned participants' comments.
Participants expressed their current sentiment with words like “chaos” and “insanity”, in order to describe the turmoil spurred by US President Donald Trump’s tariffs. That gives a flurry of how things are unwinding in the US under the current tariff schemes. US yields dip as well as traders bet on increased chances for the Fed to cut interest rates rather sooner than later, should the upcoming US economic data this week, with the preliminary Q1 Gross Domestic Product (GDP) and the Nonfarm Payrolls (NFP) for April, be as gruesome as the Dallas Fed Manufacturing print.
On the economic calendar front, there is some lighter data ahead on Tuesday, with the central theme on the JOLTS Job Openings report for March. Although this is backward-looking, before US tariffs were implemented, it could already give a sentiment if US companies were preparing for an impact and reduced their job hiring activity. Besides that, the preliminary US Goods Trade Balance for March is also expected.
Daily digest market movers: Is this just the beginning?
- At 12:30 GMT, the preliminary US Goods Trade Balance for March is due. No forecast available with the previous deficit at $147 billion.
- Preliminary Wholesale Inventories for March are also due at the same time, expected to tick up 0.7% from the 0.3% increase in February.
- At 13:00 GMT, the February House Price Index is due. It is expected to tick up 0.3% from 0.2% in February.
- At 14:00 GMT, the JOLTS Job Openings report for March is expected to contract further to 7.5 million, coming from 7.568 million previously. The Consumer Confidence for April is also due, though no forecast is available.
- Equities are steady with very small gains to report overall, on average below 0.5% for both European indices and the US Futures markets.
- The CME FedWatch tool shows the chance of an interest rate cut by the Federal Reserve in the May’s meeting stands at 8.9% against a 91.1% probability of no change. The June meeting sees a 62.6% chance of a rate cut.
- The US 10-year yields trade around 4.23%, ticking a bit lower with traders slowly but surely buying back into US bonds.
US Dollar Index Technical Analysis: Nothing moving
The US Dollar Index (DXY) is not going anywhere as traders keep their powder dry for the US key economic data later this week. Meanwhile some geopolitical headlines on easing tariffs are off-setted by headlines from China or other countries in response to the Trump administration. When looking at US data, the Dallas Fed Manufacturing survey could be the first real sign that the US economic performance will start to deteriorate, calling for quick interest rate cuts from the Fed, and a weaker US Dollar before US economic numbers recover again.
On the upside, the DXY’s first resistance comes in at 100.22, which supported the DXY back in September 2024, with a break back above the 100.00 round level as a bullish signal. A firm recovery would be a return to 101.90, which acted as a pivotal level throughout December 2023 and again as a base for the inverted head-and-shoulders formation during the summer of 2024.
On the other hand, the 97.73 support could quickly be tested on any substantial bearish headline. Further below, a relatively thin technical support comes in at 96.94 before looking at the lower levels of this new price range. These would be at 95.25 and 94.56, meaning fresh lows not seen since 2022.
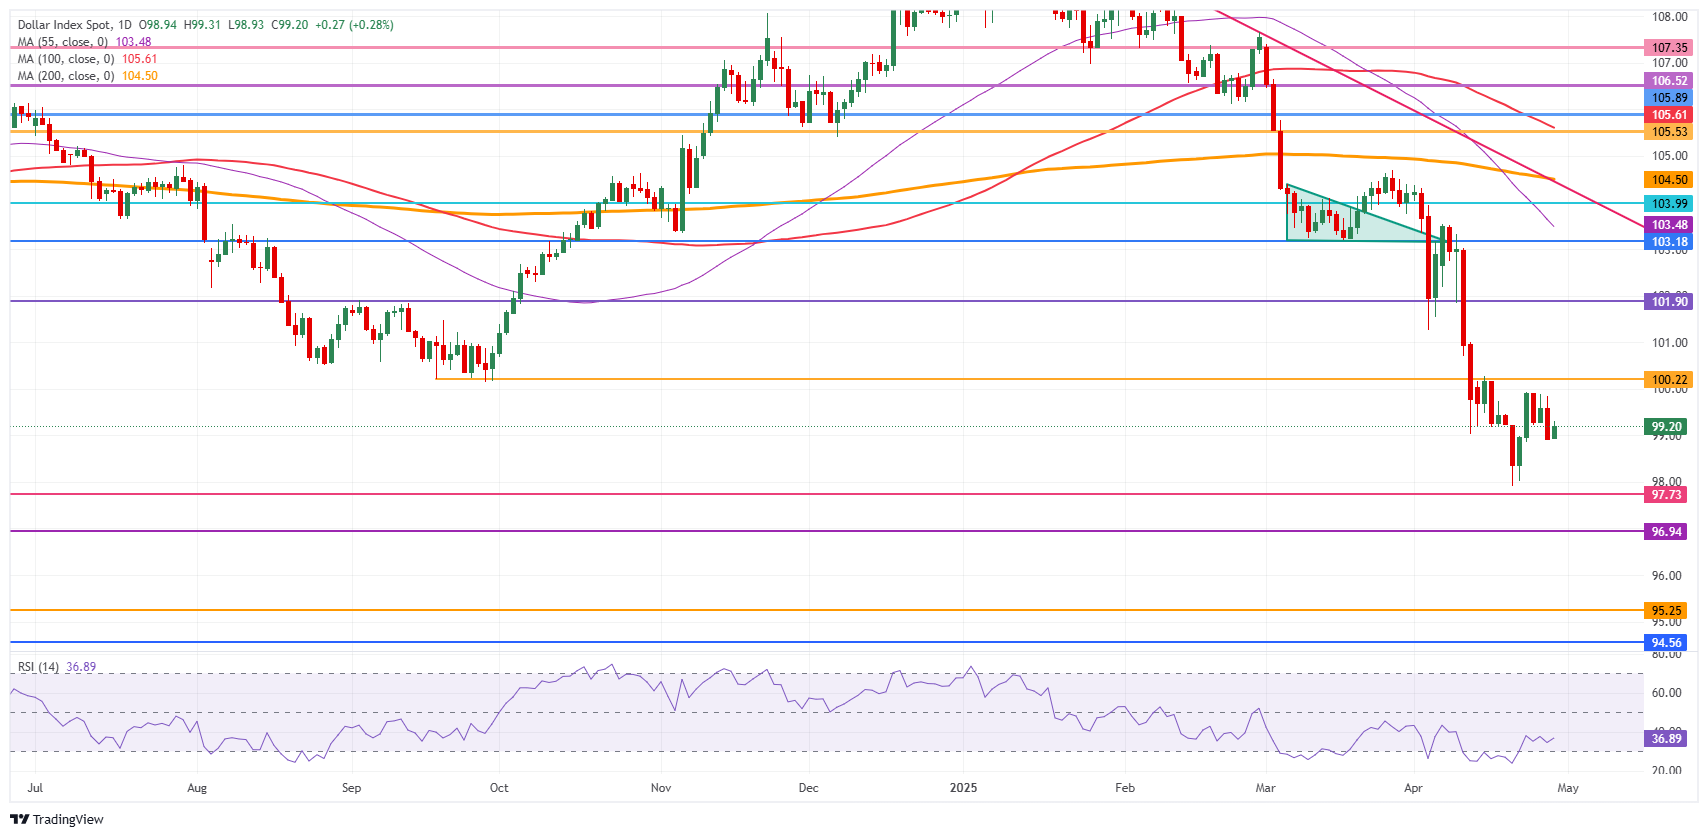
US Dollar Index: Daily Chart
US-China Trade War FAQs
Generally speaking, a trade war is an economic conflict between two or more countries due to extreme protectionism on one end. It implies the creation of trade barriers, such as tariffs, which result in counter-barriers, escalating import costs, and hence the cost of living.
An economic conflict between the United States (US) and China began early in 2018, when President Donald Trump set trade barriers on China, claiming unfair commercial practices and intellectual property theft from the Asian giant. China took retaliatory action, imposing tariffs on multiple US goods, such as automobiles and soybeans. Tensions escalated until the two countries signed the US-China Phase One trade deal in January 2020. The agreement required structural reforms and other changes to China’s economic and trade regime and pretended to restore stability and trust between the two nations. However, the Coronavirus pandemic took the focus out of the conflict. Yet, it is worth mentioning that President Joe Biden, who took office after Trump, kept tariffs in place and even added some additional levies.
The return of Donald Trump to the White House as the 47th US President has sparked a fresh wave of tensions between the two countries. During the 2024 election campaign, Trump pledged to impose 60% tariffs on China once he returned to office, which he did on January 20, 2025. With Trump back, the US-China trade war is meant to resume where it was left, with tit-for-tat policies affecting the global economic landscape amid disruptions in global supply chains, resulting in a reduction in spending, particularly investment, and directly feeding into the Consumer Price Index inflation.
추천 기사


