

US Dollar stabilizes after Fed Waller alludes to March rate cut
- The US Dollar consolidates further at current levels on Friday.
- Markets are left clueless after Fed’s Waller comments a March rate cut is still in the cards.
- The US Dollar Index (DXY) holds around 109.00 and is looking for direction.
The US Dollar Index (DXY), which tracks the Greenback’s value against six major currencies, further consolidates around the 109.00 level on Friday, though positioning is being torn into two camps. After a pivotal move earlier this week on the back of the US Consumer Price Index (CPI) for December, Federal Reserve (Fed) Governor Christopher Waller added some more oil to the fire on Thursday, alluding that a March rate cut would still be appropriate. Traders are now left clueless ahead of President-elect Donald Trump’s inauguration on Monday.
The US economic calendar is very slim this Friday, with some housing data for December on the agenda. Expect traders to consolidate their positions ahead of Monday, when US stock markets will be closed in observance of Martin Luther King Day.
Daily digest market movers: Venture a bet before Monday
- Traders are torn on Friday by comments from Federal Reserve Governor Christopher Waller, who advocated for a Fed rate cut in March on Thursday.
- Meanwhile, the Trump administration has confirmed a battery of executive orders that will be issued once President-elect Donald Trump takes office as the 47th President of the United States on Monday. Those orders include a whole batch of fiscal measures, tariff levies, and stimulus packages, which are bound to have an inflationary impact.
- At 13:30 GMT, US Building Permits and Housing Starts for December will be released. Permits are expected to decline to 1.460 million from 1.493 million the previous month, while Housing Starts should soar to 1.32 million, coming from 1.289 million units in November.
- At 14:15 GMT, US Industrial Production data is expected to show a 0.3% increase in December, compared to the slight contraction of 0.1% in the previous month.
- Equities are in the green on Friday after their hectic performance on Thursday. There are no real outliers to report, with all three main US indices futures comfortably booking gains ahead of the US opening bell.
- The CME FedWatch Tool projects a 97.3% chance that interest rates will be kept unchanged at current levels in the January meeting. Expectations are for the Federal Reserve (Fed) to remain data-dependent with uncertainties that could influence the inflation path once President-elect Donald Trump takes office on Monday.
- The US 10-year yield is trading around 4.596%, plunging near 4.5% from its Tuesday’s peak of 4.807%.
US Dollar Index Technical Analysis: Someone is not sticking to the plan
The US Dollar Index (DXY) is taking it on the chin, and Federal Reserve Governor Christopher Waller delivered the possible knockout blow on the Greenback for now. Waller's bold call for a March rate cut surprised traders and was not priced into market expectations. A wrong-footed market could result now, as the Fed was supposed to remain data-dependent. This could set up markets for an erroneous positioning once President-elect Donald Trump starts to roll out his policy.
On the upside, the 110.00 psychological level remains the key resistance to beat. Further up, the next big upside level to hit before advancing any further remains at 110.79. Once beyond there, it is quite a stretch to 113.91, the double top from October 2022.
On the downside, the DXY is testing the ascending trend line from December 2023, which currently comes in around 108.95 as nearby support. In case of more downside, the next support is 107.35. Further down, the next level that might halt any selling pressure is 106.52, with interim support at the 55-day Simple Moving Average (SMA) at 107.19.
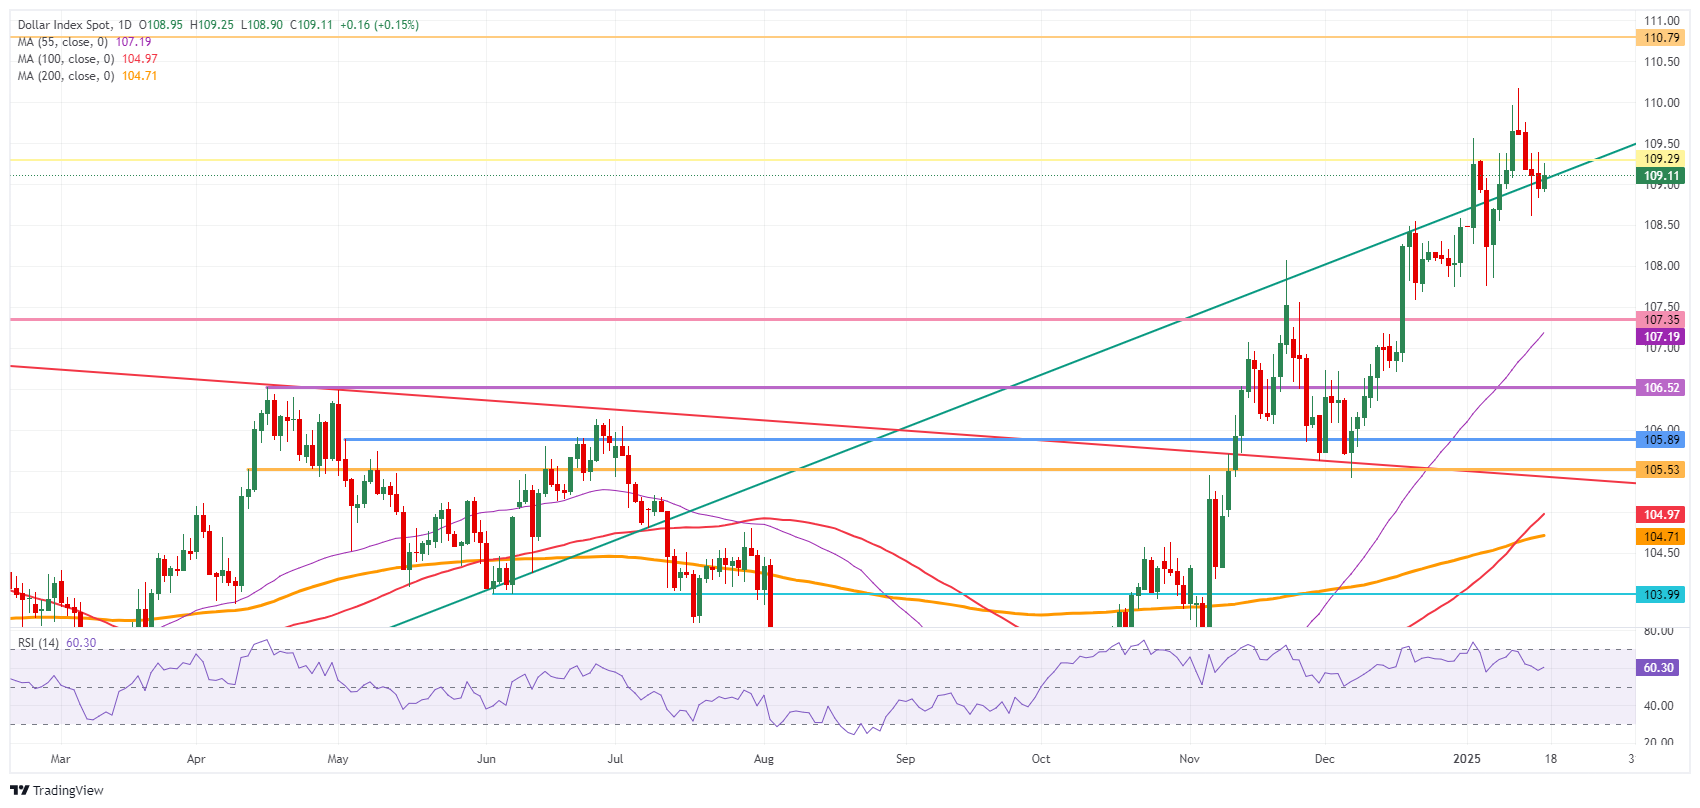
US Dollar Index: Daily Chart
US Dollar FAQs
The US Dollar (USD) is the official currency of the United States of America, and the ‘de facto’ currency of a significant number of other countries where it is found in circulation alongside local notes. It is the most heavily traded currency in the world, accounting for over 88% of all global foreign exchange turnover, or an average of $6.6 trillion in transactions per day, according to data from 2022. Following the second world war, the USD took over from the British Pound as the world’s reserve currency. For most of its history, the US Dollar was backed by Gold, until the Bretton Woods Agreement in 1971 when the Gold Standard went away.
The most important single factor impacting on the value of the US Dollar is monetary policy, which is shaped by the Federal Reserve (Fed). The Fed has two mandates: to achieve price stability (control inflation) and foster full employment. Its primary tool to achieve these two goals is by adjusting interest rates. When prices are rising too quickly and inflation is above the Fed’s 2% target, the Fed will raise rates, which helps the USD value. When inflation falls below 2% or the Unemployment Rate is too high, the Fed may lower interest rates, which weighs on the Greenback.
In extreme situations, the Federal Reserve can also print more Dollars and enact quantitative easing (QE). QE is the process by which the Fed substantially increases the flow of credit in a stuck financial system. It is a non-standard policy measure used when credit has dried up because banks will not lend to each other (out of the fear of counterparty default). It is a last resort when simply lowering interest rates is unlikely to achieve the necessary result. It was the Fed’s weapon of choice to combat the credit crunch that occurred during the Great Financial Crisis in 2008. It involves the Fed printing more Dollars and using them to buy US government bonds predominantly from financial institutions. QE usually leads to a weaker US Dollar.
Quantitative tightening (QT) is the reverse process whereby the Federal Reserve stops buying bonds from financial institutions and does not reinvest the principal from the bonds it holds maturing in new purchases. It is usually positive for the US Dollar.
추천 기사


