

Dow Jones Industrial Average churns the charts after hot CPI print
- The Dow Jones shed around 100 points on Thursday before grinding back to the middle.
- US CPI data came in hotter than expected, US Initial Jobless Claims also rose.
- Markets are firmly planted in bets for a 25 bps November cut.
The Dow Jones Industrial Average (DJIA) pared back on some of the week’s earlier gains after US Consumer Price Index (CPI) inflation figures from September failed to meet market expectations. US Initial Jobless Claims also accelerated to its highest week-on-week figure in over a year, flashing a warning sign that the labor market, while still relatively healthy, still has plenty of wiggle room for some slack in employment figures.
Headline US CPI inflation ticked down to 2.4% YoY in September, easing back from the previous 2.5%, but stuck stubbornly higher than the expected 2.3%. Annualized core CPI inflation also ticked higher to 3.3%, flummoxing the anticipated hold at 3.2%. Still-sticky inflation figures threaten market hopes for a faster, deeper pace of rate cuts from the Federal Reserve (Fed).
US Initial Jobless Claims rose to 258K for the week ended October 4, over and above the expected 230K and climbing above the previous week’s print of 225K. While still within the realm of reasonable, it was still the highest level of week-on-week new unemployment benefits seekers since May of 2023.
Investors are left in a tricky position after Thursday’s data points: Still-high inflation makes it even harder for the Fed to deliver further rate cuts, but softening labor figures could tilt the Fed into further, deeper rate trims. However, too-steep of a pivot into souring labor data would be a significant warning sign of an impending recession, which would certainly spike the pace of Fed rate cuts higher, but would outright threaten the stability of equity markets.
According to the CME’s FedWatch Tool, rate traders have piled back into bets of a 25 bps rate trim in November, with 90% odds the Fed will deliver a quarter-point rate cut on November 7. The remaining 10% pool is expecting no move at all from the Fed next month.
Dow Jones news
The Dow Jones struggled its way back to the even mark after an initial 100-point dump to kick off Thursday’s US market session. Despite recovering balance, a full two-thirds of the major equity board is testing into the red for the day. Amazon (AMZN) still managed to find the high side, climbing over 1% and testing north of $187 per share.
Dow Jones price forecast
The Dow Jones Industrial Average (DJIA) is showing signs of consolidation after rallying from early October lows. It's trading just below recent highs above 42600, with a slight 0.10% decline for the day. The 50-day exponential moving average (EMA) at 41,300 is providing strong support, and price action remains well above both the 50-day and the 200-day EMA at 39,173, confirming the broader uptrend.
Momentum indicators are showing mixed signals. The Moving Average Convergence Divergence (MACD) line is slightly above the signal line, suggesting a slowdown in upward momentum. Traders are closely monitoring whether the MACD line will cross below the signal line, which could be an early sign of a short-term pullback.
As long as the index continues to trade above key support levels, the upward trend remains intact. However, a break below the 50-day EMA could trigger more pronounced selling pressure, potentially pushing the index toward the 200-day EMA. Traders will be closely watching to see if the index can surpass current resistance levels or if it will enter a period of consolidation amid uncertainties in the macroeconomic environment.
Dow Jones daily chart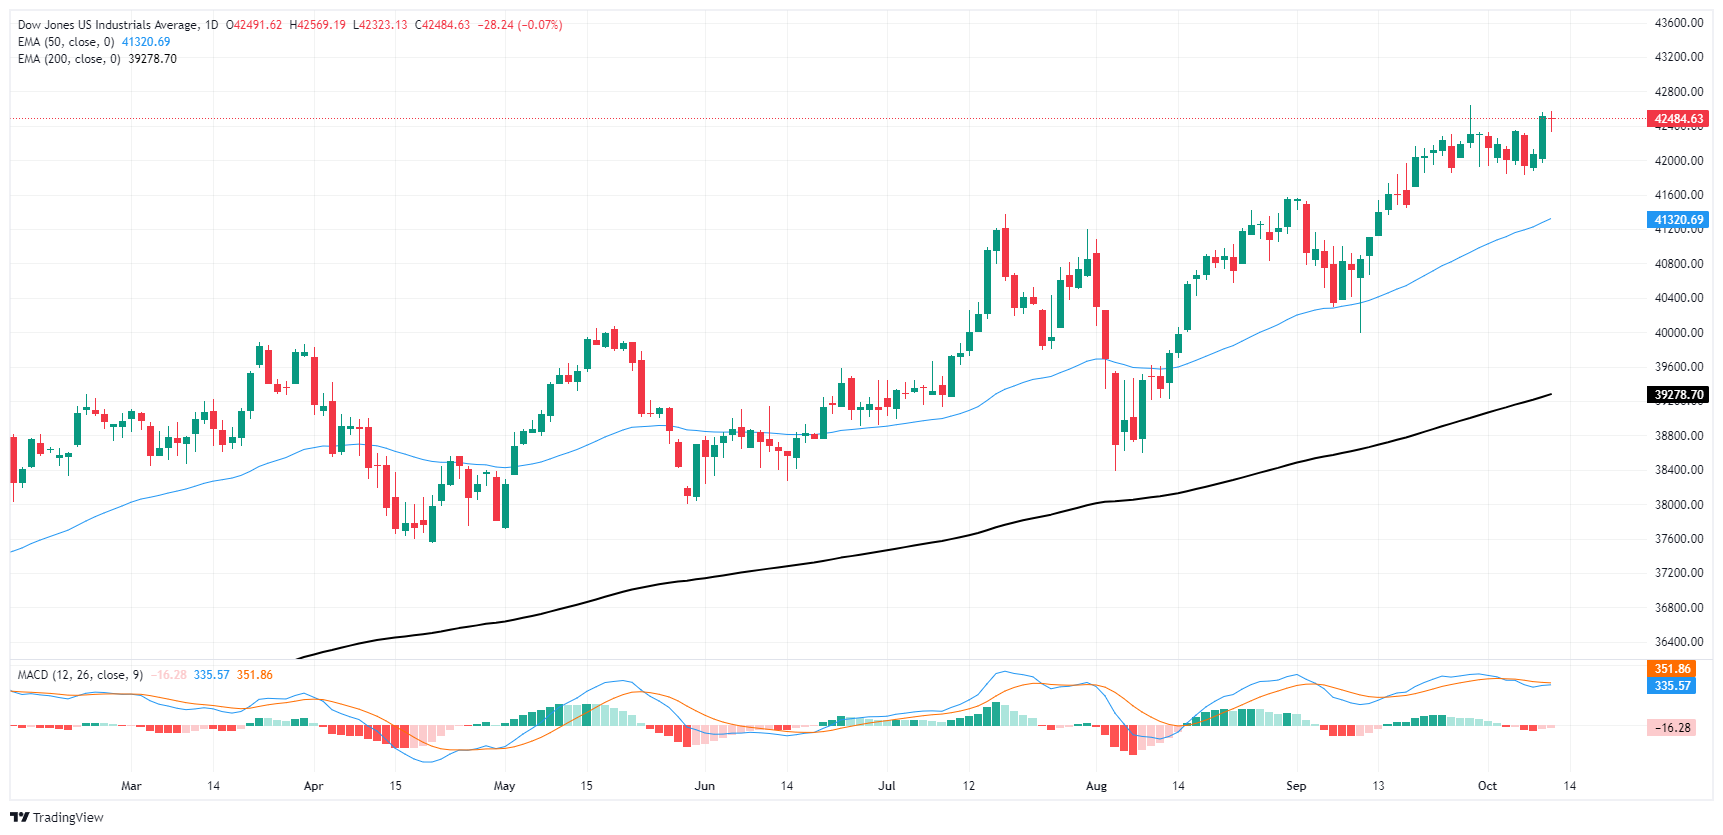
Dow Jones FAQs
The Dow Jones Industrial Average, one of the oldest stock market indices in the world, is compiled of the 30 most traded stocks in the US. The index is price-weighted rather than weighted by capitalization. It is calculated by summing the prices of the constituent stocks and dividing them by a factor, currently 0.152. The index was founded by Charles Dow, who also founded the Wall Street Journal. In later years it has been criticized for not being broadly representative enough because it only tracks 30 conglomerates, unlike broader indices such as the S&P 500.
Many different factors drive the Dow Jones Industrial Average (DJIA). The aggregate performance of the component companies revealed in quarterly company earnings reports is the main one. US and global macroeconomic data also contributes as it impacts on investor sentiment. The level of interest rates, set by the Federal Reserve (Fed), also influences the DJIA as it affects the cost of credit, on which many corporations are heavily reliant. Therefore, inflation can be a major driver as well as other metrics which impact the Fed decisions.
Dow Theory is a method for identifying the primary trend of the stock market developed by Charles Dow. A key step is to compare the direction of the Dow Jones Industrial Average (DJIA) and the Dow Jones Transportation Average (DJTA) and only follow trends where both are moving in the same direction. Volume is a confirmatory criteria. The theory uses elements of peak and trough analysis. Dow’s theory posits three trend phases: accumulation, when smart money starts buying or selling; public participation, when the wider public joins in; and distribution, when the smart money exits.
There are a number of ways to trade the DJIA. One is to use ETFs which allow investors to trade the DJIA as a single security, rather than having to buy shares in all 30 constituent companies. A leading example is the SPDR Dow Jones Industrial Average ETF (DIA). DJIA futures contracts enable traders to speculate on the future value of the index and Options provide the right, but not the obligation, to buy or sell the index at a predetermined price in the future. Mutual funds enable investors to buy a share of a diversified portfolio of DJIA stocks thus providing exposure to the overall index.
추천 기사


