

US Dollar extends correction with China reopening
- The US Dollar trades mixed against G10 currencies during the European session on Tuesday.
- China markets are back again after the Golden Week closure, triggering a surge in volatility.
- The US Dollar Index trades still above 102.00, though entering a second downbeat trading day.
The US Dollar (USD) eases for a second day in a row with investors welcoming China back to the markets. It is not a warm welcome, with the Chinese Hang Seng 300 Index down over 9% at its closing bell. A surge in risk-off is taking place, with European stocks on the backfoot as well.
The economic calendar is light and should not create big waves on Tuesday, with the Goods Trade Balance and the Economic Optimism Index not expected to be market movers. Comments from Federal Reserve Bank of Atlanta President Raphael Bostic and Federal Reserve Vice Chair Phillip Jefferson, however, could be.
Daily digest market movers: Hangover mode for China
- China has reopened again after a week of festivities for the Golden Week. The festive mode has rather quickly dampened, with the Hang Seng Index correcting near 10% at its closing bell. The negative reaction spilled over into European markets and some risk-off across the board.
- At 10:00 GMT, the National Federation of Independent Business (NFIB) released its Business Optimism Index for September, which raised to 91.5 from 91.2 in August, falling short of economist expectations of 91.7.
- The Goods and Services Trade Balance data from August is expected to be released at 12:30 GMT. The Goods and Services Trade Balance should see a smaller deficit of $-70.4 billion compared to the wider $-78.8 billion in July. The Trade Balance excluding Services showed previously a deficit of $-94.3 billion, with no forecast available.
- The TechnoMetrica Institute of Policy and Politics will release at 14:00 GMT the Economic Optimism Index for October. A small uptick to 47.2 is expected, coming from 46.1, though indicating ongoing consumer pessimism.
- At 16:45 GMT, Federal Reserve Bank of Atlanta President Raphael Bostic (2024 FOMC voting member) speaks about the US economic outlook at the Atlanta Consular Corps luncheon. At 22:30 GMT, Federal Reserve Vice Chair Phillip Jefferson (2024 FOMC voting member) delivers a speech at an event organized by the Davidson College in Davidson, North Carolina.
- As mentioned above, European equities are being infected with a negative tone coming from China. All European indices are down by 1%. US Futures are still looking for direction ahead of the US opening bell.
- The CME Fedwatch Tool shows an 88.7% chance of a 25 basis point (bps) interest rate cut at the next Fed meeting on November 7, while 11.3% is pricing in no rate cut. Chances for a 50 bps rate cut have been fully priced out now.
- The US 10-year benchmark rate trades at 4.00%, the highest level since mid-August.
US Dollar Index Technical Analysis: Overheated
The US Dollar Index (DXY) is easing a touch for the second day in a row. The sharp rally from last week is seeing some profit-taking for the second day in a row. The fact that the US Dollar can not gain further even with the risk-off tone from Asia could mean that a short squeeze has been completed and might see a slow grind lower from here.
The psychological 103.00 is the first level to tackle on the upside. Further up, the chart identifies 103.18 as the very final level for this week. Once above there, a very choppy area emerges, with the 100-day Simple Moving Average (SMA) at 103.32, the 200-day SMA at 103.76, and the pivotal 103.99-104.00 levels in play.
On the downside, the 55-day SMA at 101.99 is the first line of defence, backed by the 102.00 round level and the pivotal 101.90 as support to catch any bearish pressure and trigger a bounce. If that level does not work out, 100.62 also acts as support. Further down, a test of the year-to-date low of 100.16 should take place before more downside. Finally, and that means giving up the big 100.00 level, the July 14, 2023, low at 99.58 comes into play.
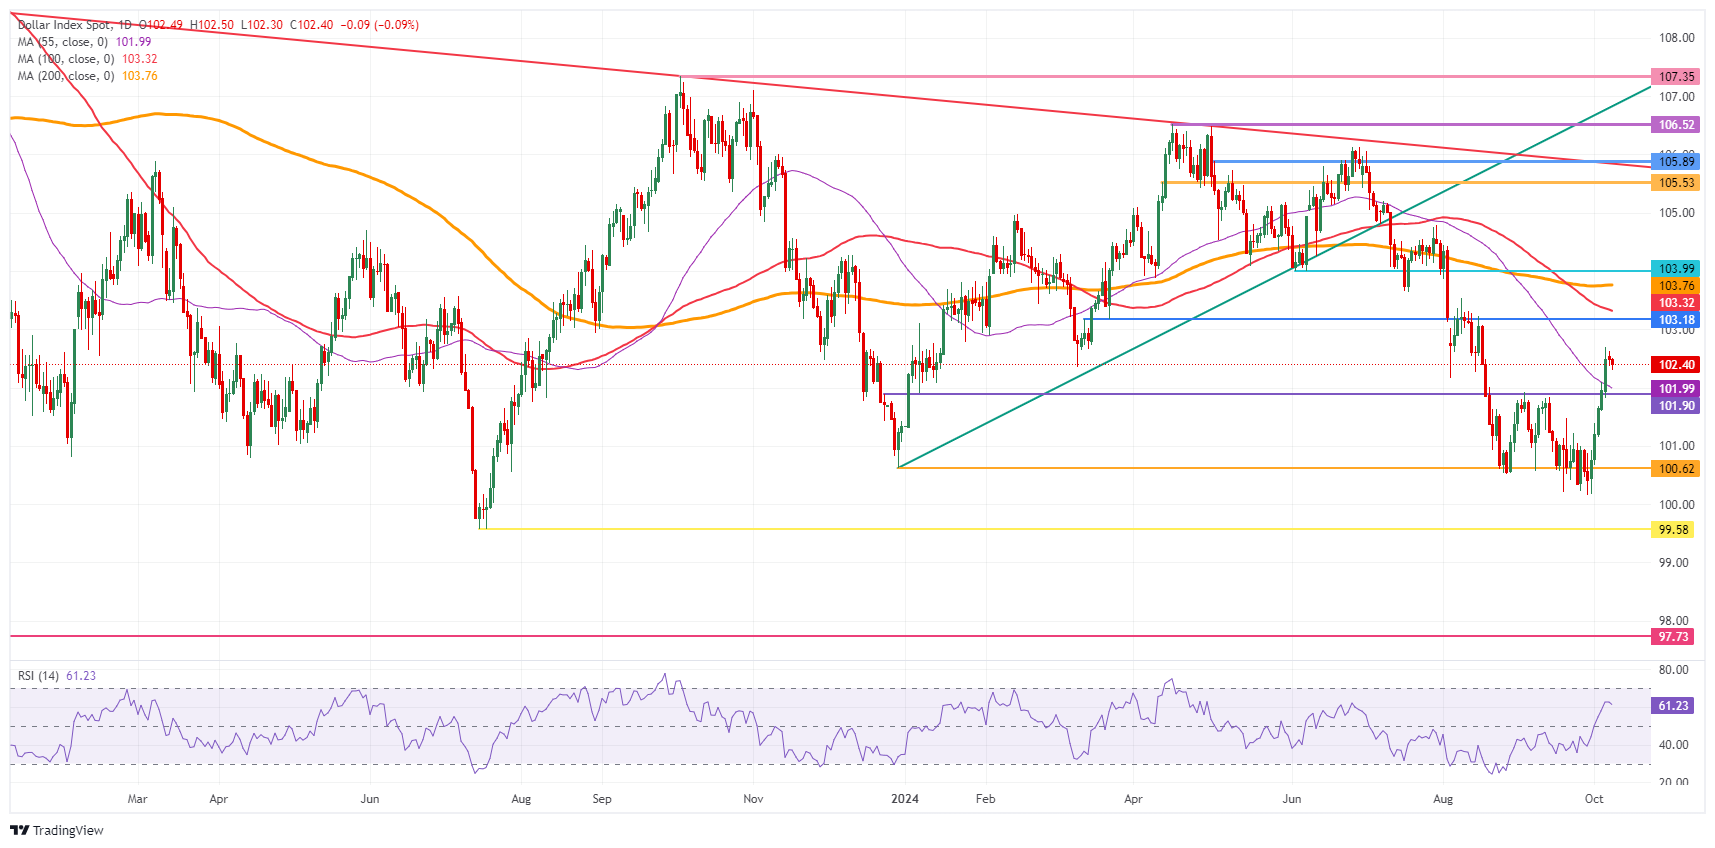
US Dollar Index: Daily Chart
US Dollar FAQs
The US Dollar (USD) is the official currency of the United States of America, and the ‘de facto’ currency of a significant number of other countries where it is found in circulation alongside local notes. It is the most heavily traded currency in the world, accounting for over 88% of all global foreign exchange turnover, or an average of $6.6 trillion in transactions per day, according to data from 2022. Following the second world war, the USD took over from the British Pound as the world’s reserve currency. For most of its history, the US Dollar was backed by Gold, until the Bretton Woods Agreement in 1971 when the Gold Standard went away.
The most important single factor impacting on the value of the US Dollar is monetary policy, which is shaped by the Federal Reserve (Fed). The Fed has two mandates: to achieve price stability (control inflation) and foster full employment. Its primary tool to achieve these two goals is by adjusting interest rates. When prices are rising too quickly and inflation is above the Fed’s 2% target, the Fed will raise rates, which helps the USD value. When inflation falls below 2% or the Unemployment Rate is too high, the Fed may lower interest rates, which weighs on the Greenback.
In extreme situations, the Federal Reserve can also print more Dollars and enact quantitative easing (QE). QE is the process by which the Fed substantially increases the flow of credit in a stuck financial system. It is a non-standard policy measure used when credit has dried up because banks will not lend to each other (out of the fear of counterparty default). It is a last resort when simply lowering interest rates is unlikely to achieve the necessary result. It was the Fed’s weapon of choice to combat the credit crunch that occurred during the Great Financial Crisis in 2008. It involves the Fed printing more Dollars and using them to buy US government bonds predominantly from financial institutions. QE usually leads to a weaker US Dollar.
Quantitative tightening (QT) is the reverse process whereby the Federal Reserve stops buying bonds from financial institutions and does not reinvest the principal from the bonds it holds maturing in new purchases. It is usually positive for the US Dollar.
추천 기사


