


Crypto Today: Bitcoin, Ethereum, XRP rally stalls despite ETF inflows boosting investor optimism
- Bitcoin holds above the 100-day EMA after correcting from the previous day’s high amid surging ETF inflows.
- Ethereum posts a minor correction on Thursday after a notable bullish move above $3,400, reflecting potential profit-taking.
- XRP declines for the second consecutive day, weighed down by a weakening technical structure.
Bitcoin (BTC) is trading lower but holds above $96,000 at the time of writing on Thursday, as the broader crypto market pulls back from recent highs driven by investors' optimism and rising institutional interest.
Ethereum (ETH) and Ripple (XRP) are also edging lower, with the former trading above $3,300, while XRP tests support at $2.10. Looking ahead, profit-taking could take centre stage, but fresh entries from traders could trigger the next bullish leg.
Crypto ETF inflows surge, igniting optimism for a BTC, ETH and XRP rally
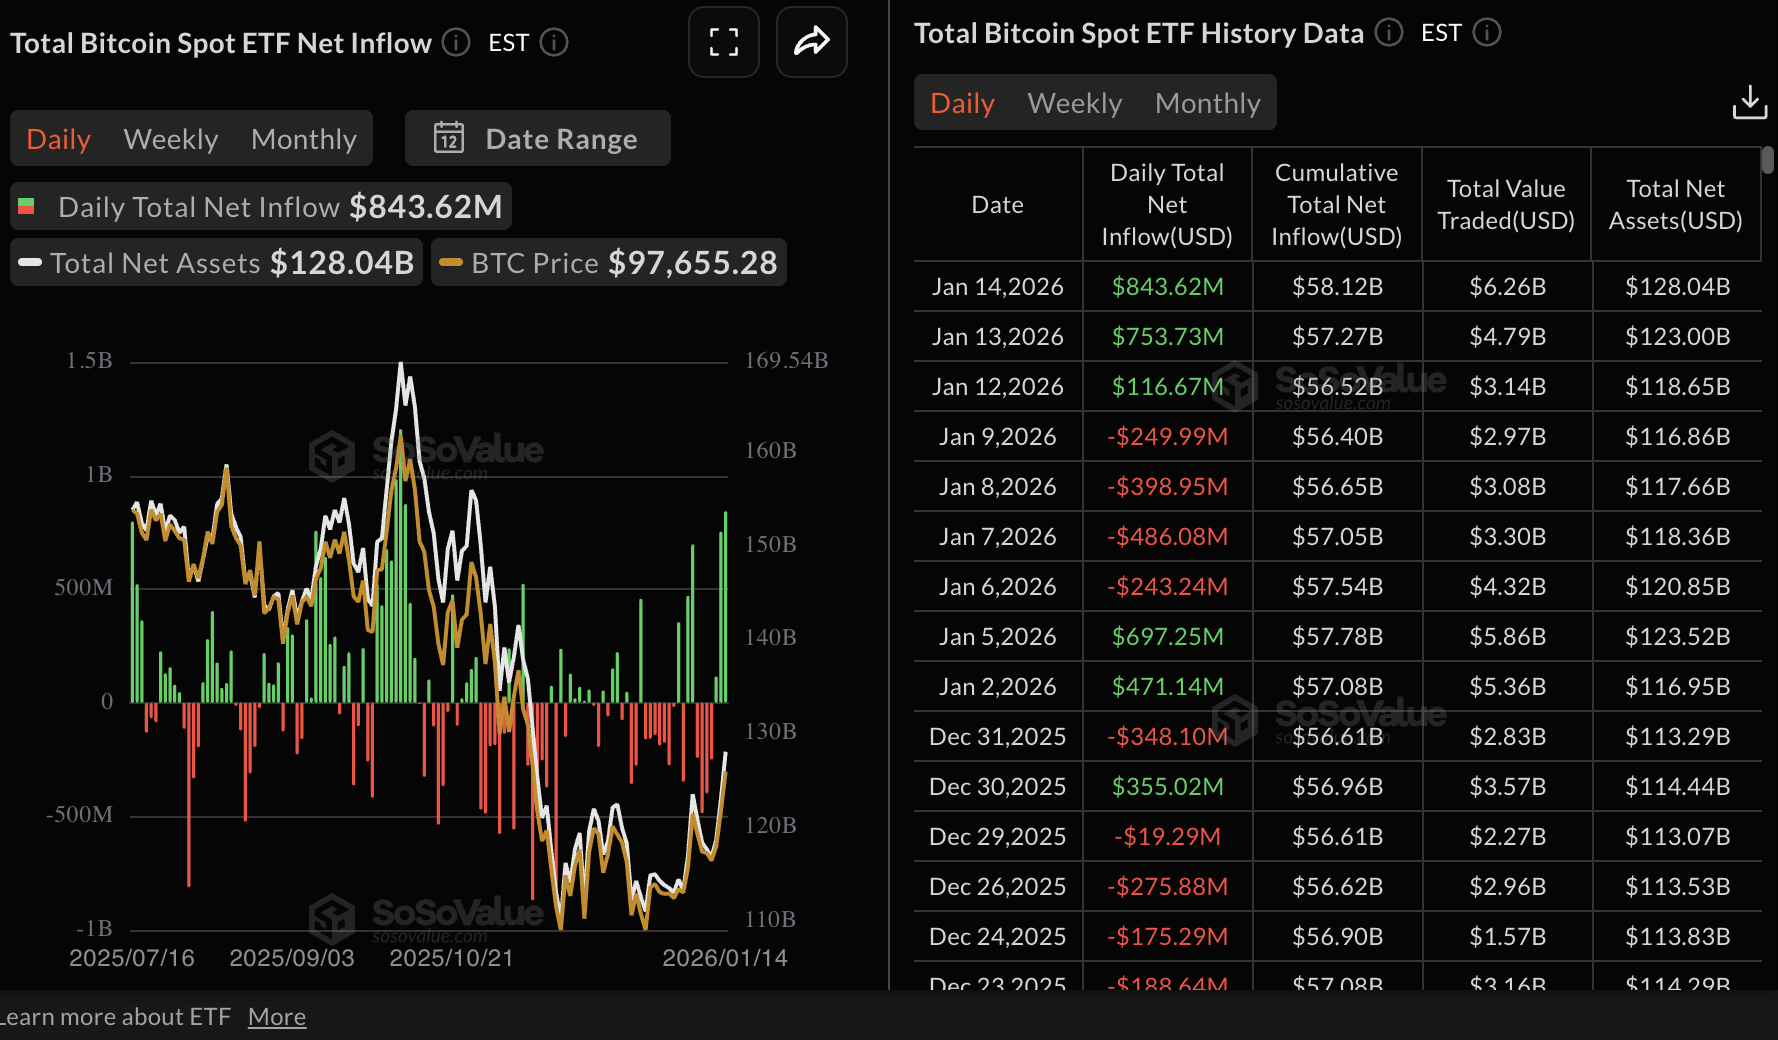
Bitcoin spot Exchange Traded Funds (ETFs) extended their inflow streak for the third consecutive day, drawing approximately $844 million on Wednesday. Interest in spot BTC ETFs listed in the United States (US) has increased significantly this week, with inflows totaling 117 million on Monday and $754 million on Tuesday.
The cumulative inflow stands at $58.12 billion and net assets at $128 billion, indicating that investors' confidence is returning after weeks of mild inflows and deteriorating sentiment.
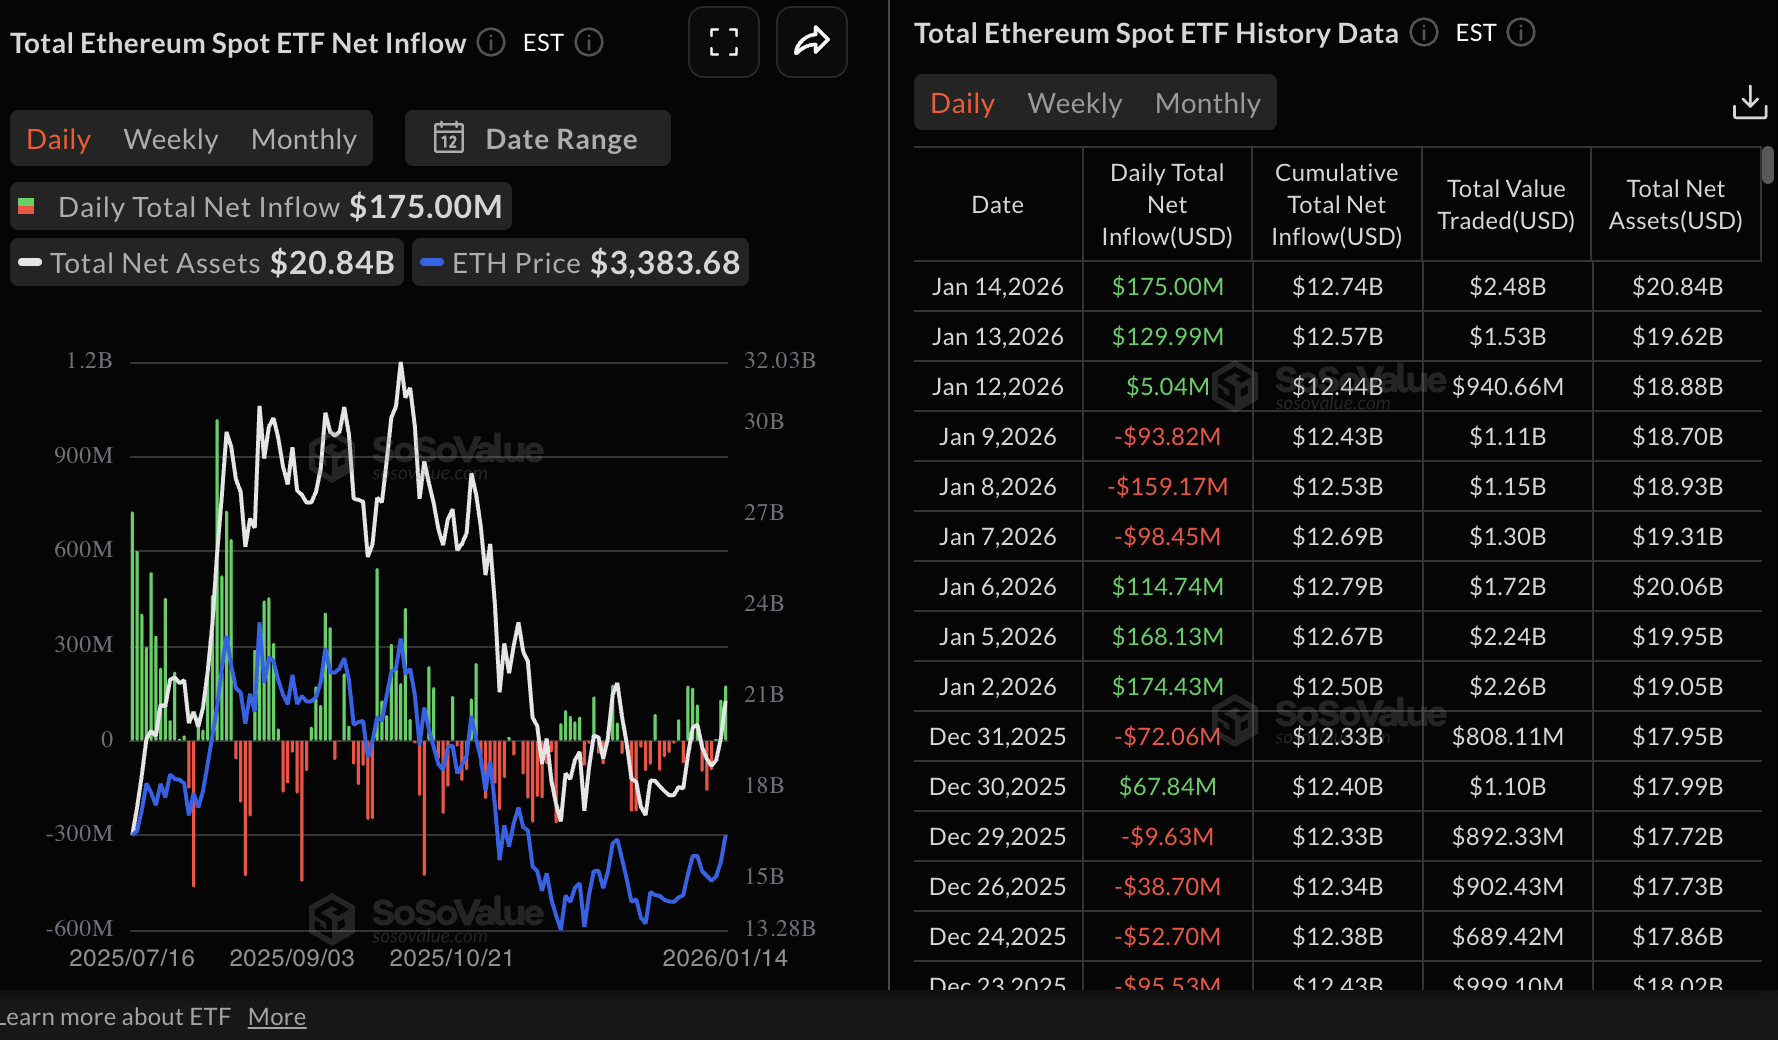
Ethereum spot ETFs also recorded a surge in inflows, with investors depositing $175 million on Wednesday, up from approximately $130 million on Tuesday and $5 million on Monday. The uptake of ETFs pushed cumulative inflows to $12.74 billion and net assets to $20.84 billion, according to SoSoValue data. If the interest steadies and market sentiment continues to improve, Ethereum would be poised for the next leg up.
Meanwhile, XRP spot ETFs recorded a slight decrease in inflows, falling to nearly $11 million on Wednesday from $13 million the previous day. Overall demand for XRP ETFs remains steady, with only one day of outflows – roughly $41 million on January 7 – posted since launch. Cumulative inflows stand at $1.26 billion, with net assets totaling $1.56 billion.
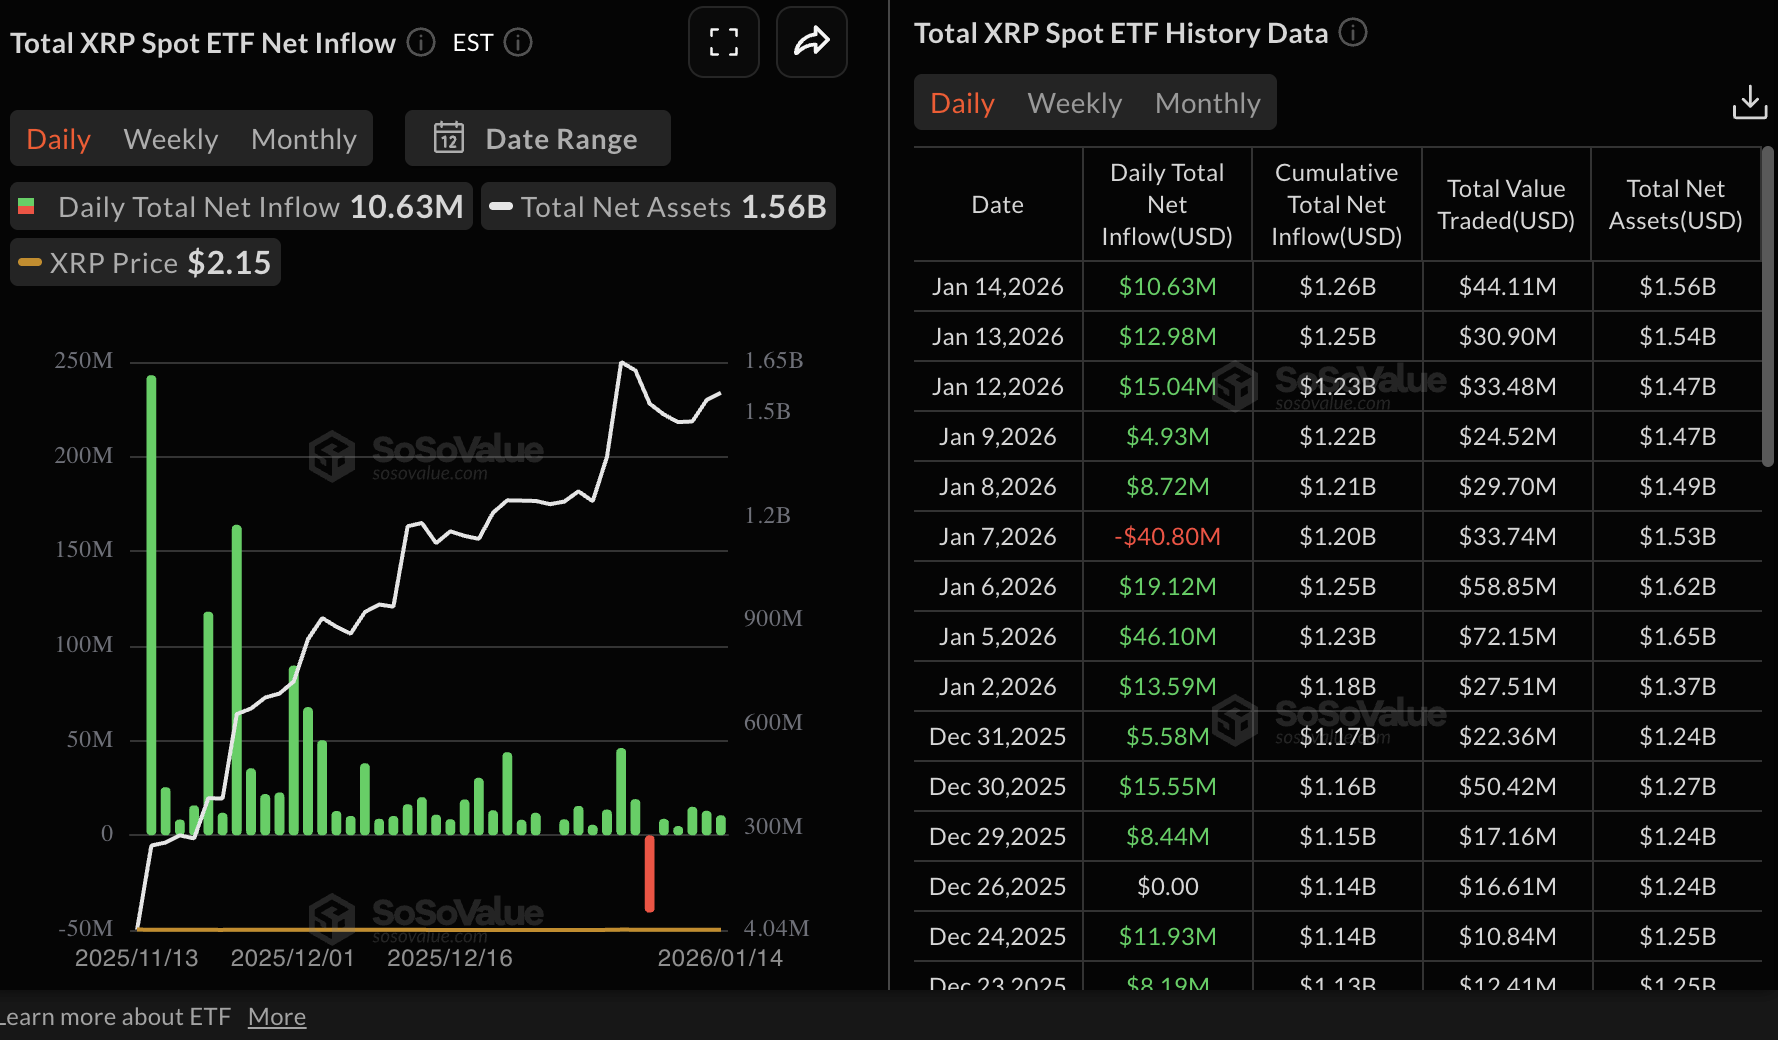
Chart of the day: What’s next as Bitcoin corrects?
Bitcoin is trading above $96,000 at the time of writing on Thursday, after correcting from the previous day’s high of $97,924. The Relative Strength Index (RSI) has retraced to 68 on the daily chart after approaching overbought territory, suggesting that bullish momentum is gradually fading.
The 100-day Exponential Moving Average (EMA) at $96,032 is poised to absorb potential selling from profit-taking. Closing below this level may accelerate losses to Wednesday’s low of $94,559. An extended sell-off drives BTC toward the 50-day EMA at $92,111.
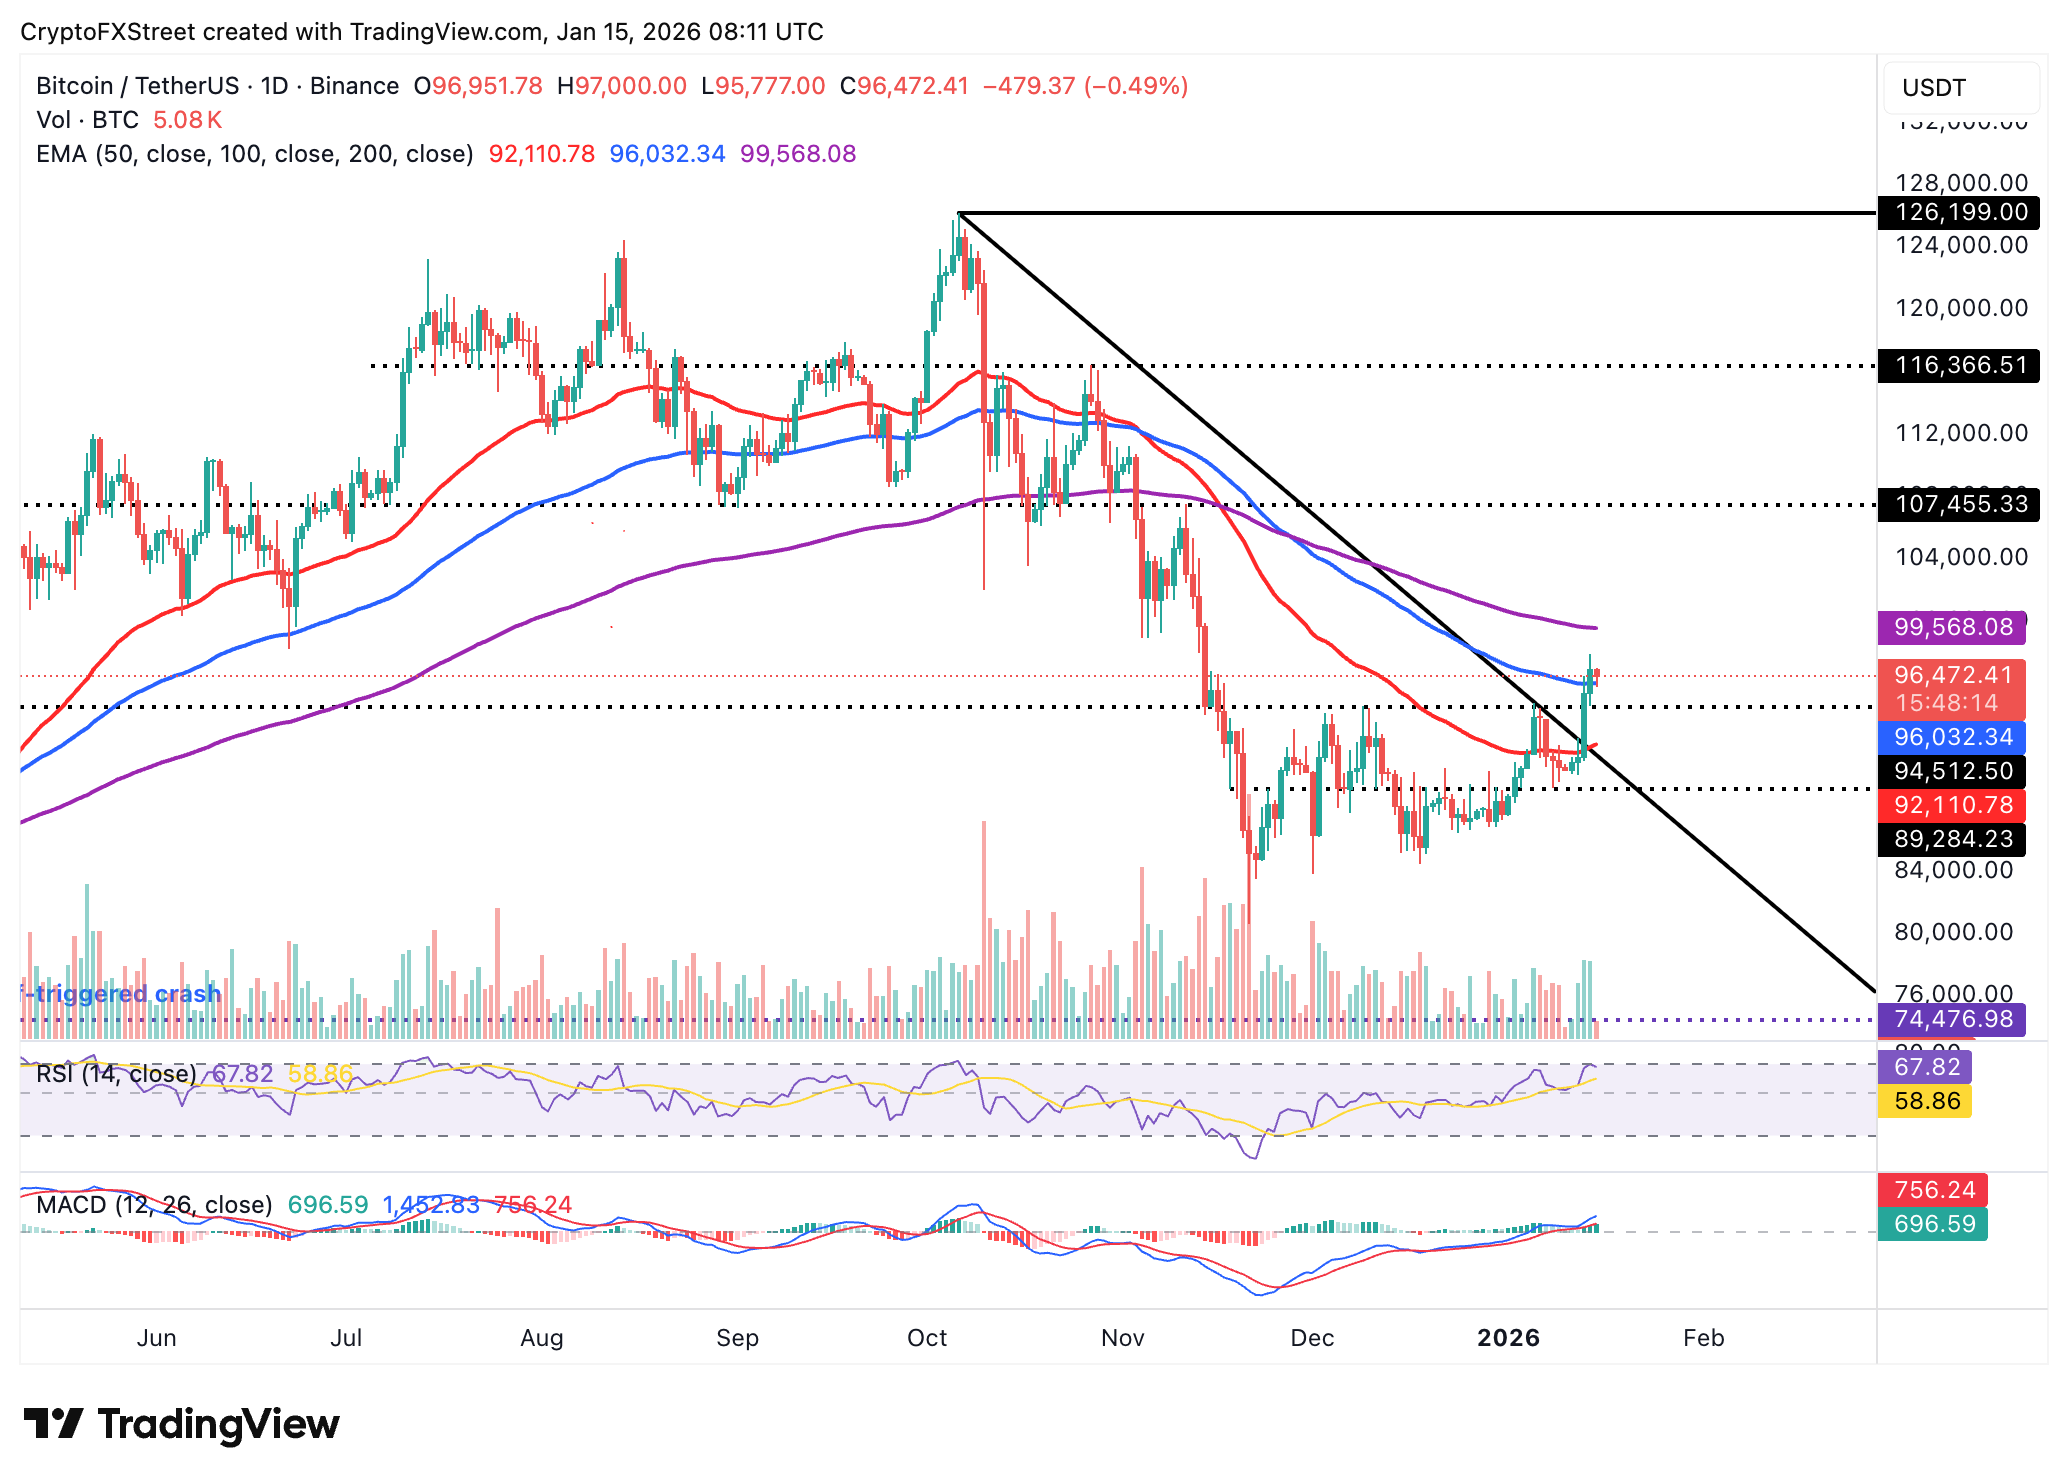
On the flip side, the 200-day EMA caps the upside at $99,570. A decisive break above this level would be needed to validate a potential continuation of the uptrend.
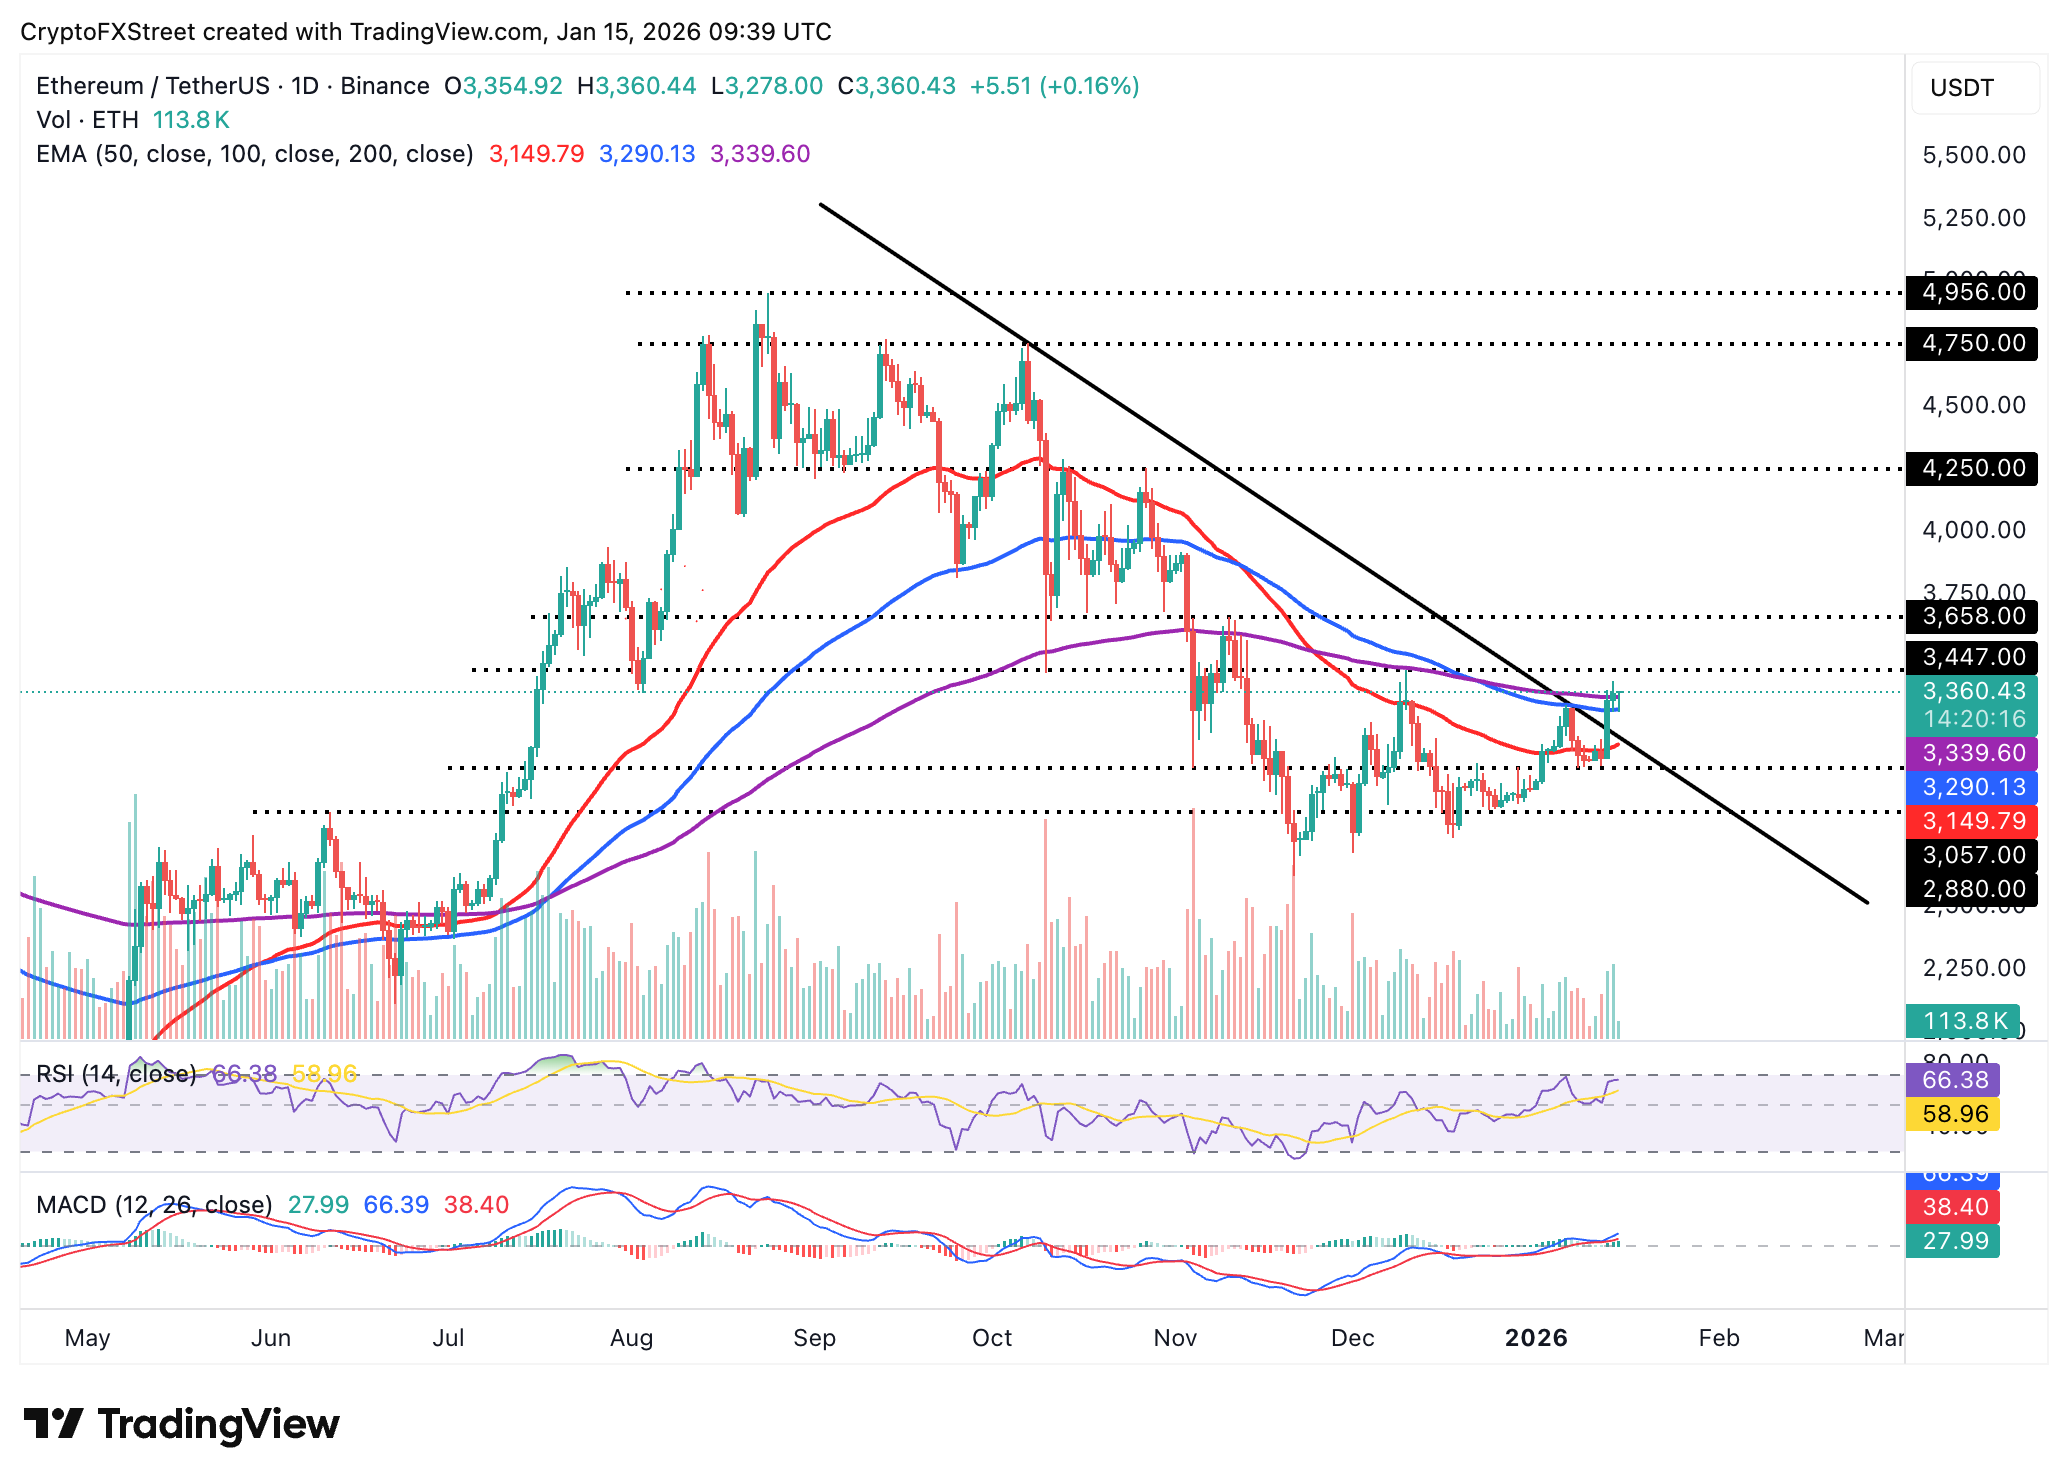
Altcoins technical outlook: Ethereum, XRP hold above key support
Ethereum is trading above $3,300 at the time of writing on Thursday, with the 100-day EMA upholding a short-term support at $3,290. The RSI has stabilized at 66 on the daily chart, signaling consolidation before the next move.
Looking ahead, bulls are battling to keep ETH above the 200-day EMA at $3,340, which would help reinforce the uptrend.
The Moving Average Convergence Divergence (MACD) indicator on the same chart remains above the signal line, a position that may prompt investors to increase their risk exposure.
Key milestones that should be achieved to confirm Ethereum’s bullish outlook are a break above resistance at $3,447, tested on December 10 and $3,658, tested on November 10.
However, if profit-taking overshadows demand and ETH breaks below the 100-day EMA at $3,290, the correction may extend by almost 9% to $3,000.
As for XRP, sellers are largely in control, pushing the price downward to $2.11 at the time of writing on Thursday. The RSI has fallen to 54 on the daily chart, indicating that bullish momentum is narrowing.
An extended sell-off could weaken the 50-day EMA support at $2.08 and pave the way for losses toward the January 1 low of $1.82.
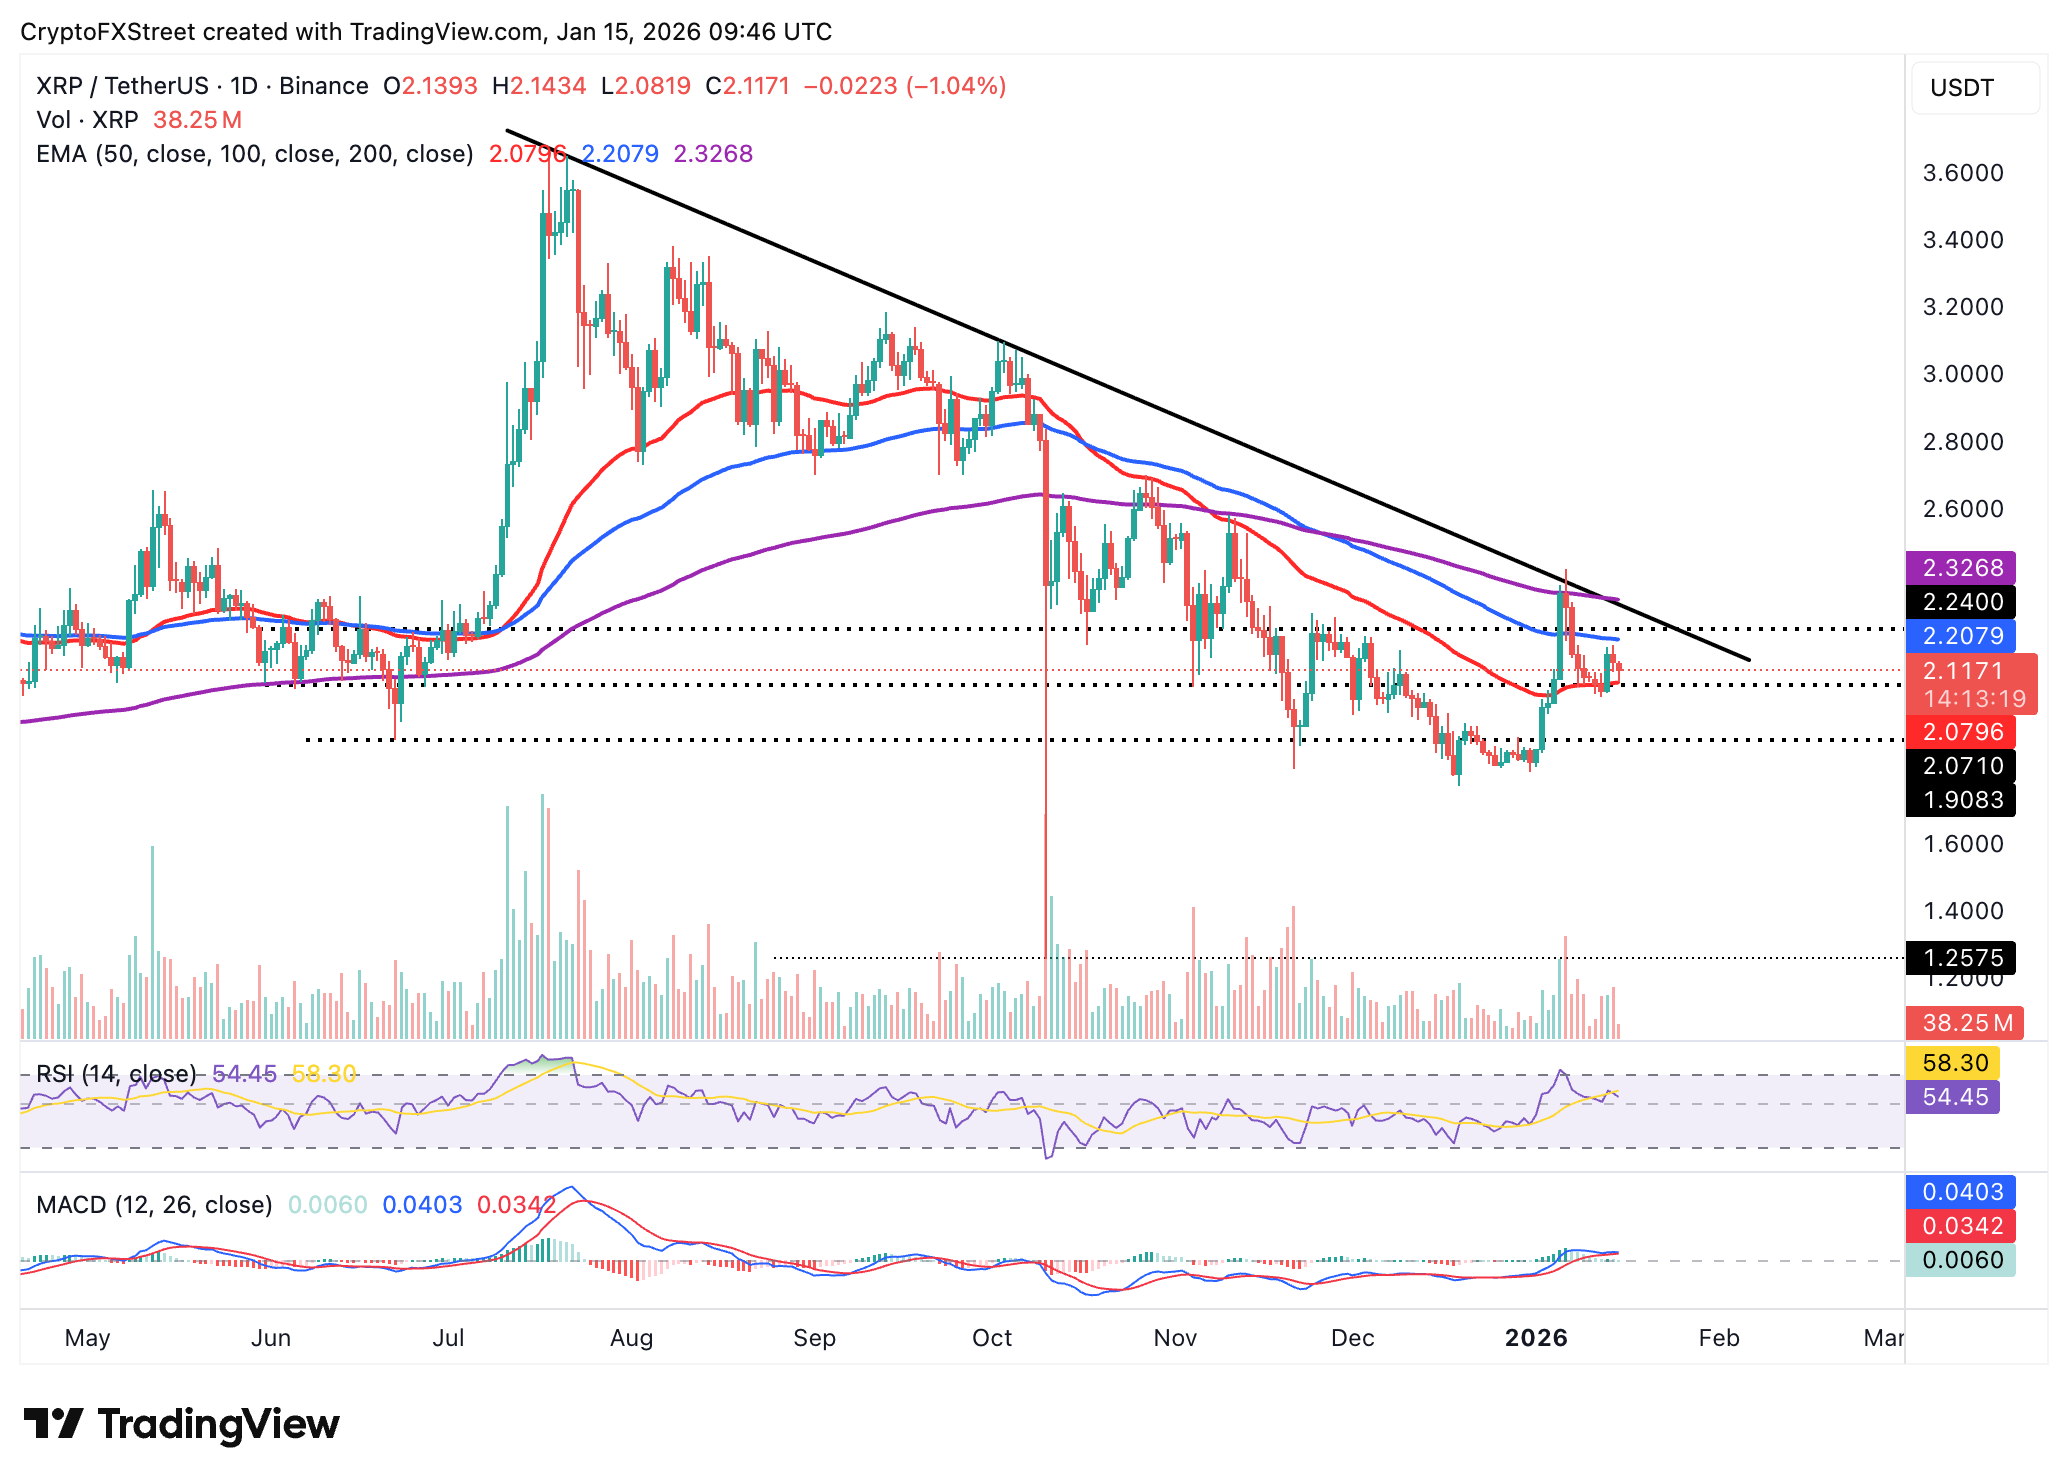
However, the MACD indicator remains above the red signal line on the same time frame, suggesting traders may seek exposure, adding to the tailwind. XRP should breach the 100-day EMA at $2.21 and the descending trend line from the record high of $3.66 to confirm a strong bullish turnaround.
Crypto ETF FAQs
An Exchange-Traded Fund (ETF) is an investment vehicle or an index that tracks the price of an underlying asset. ETFs can not only track a single asset, but a group of assets and sectors. For example, a Bitcoin ETF tracks Bitcoin’s price. ETF is a tool used by investors to gain exposure to a certain asset.
Yes. The first Bitcoin futures ETF in the US was approved by the US Securities & Exchange Commission in October 2021. A total of seven Bitcoin futures ETFs have been approved, with more than 20 still waiting for the regulator’s permission. The SEC says that the cryptocurrency industry is new and subject to manipulation, which is why it has been delaying crypto-related futures ETFs for the last few years.
Yes. The SEC approved in January 2024 the listing and trading of several Bitcoin spot Exchange-Traded Funds, opening the door to institutional capital and mainstream investors to trade the main crypto currency. The decision was hailed by the industry as a game changer.
The main advantage of crypto ETFs is the possibility of gaining exposure to a cryptocurrency without ownership, reducing the risk and cost of holding the asset. Other pros are a lower learning curve and higher security for investors since ETFs take charge of securing the underlying asset holdings. As for the main drawbacks, the main one is that as an investor you can’t have direct ownership of the asset, or, as they say in crypto, “not your keys, not your coins.” Other disadvantages are higher costs associated with holding crypto since ETFs charge fees for active management. Finally, even though investing in ETFs reduces the risk of holding an asset, price swings in the underlying cryptocurrency are likely to be reflected in the investment vehicle too.
추천 기사


