
Pi Network Price Forecast: PI loses strength amid mainnet migration boost
- Pi Network risks falling below $0.2200 as its decline continues below the 50-day EMA.
- A surge in centralized exchanges' reserves amid increasing mainnet migration signals rising supply pressure.
- The technical outlook for Pi Network remains bearish, targeting $0.1919.
Pi Network (PI) has been in a steady decline below the 50-day Exponential Moving Average (EMA), trading near $0.2200 at press time on Monday. The mobile mining cryptocurrency risks further losses as supply reserves on Centralized Exchanges (CEXs) surge amid a sharp increase in mainnet token migration. The technical outlook for the PI token highlights that the path of least resistance is to the downside.
Supply pressure on the rise
A steady rise in PI token deposits on exchanges indicates increased selling pressure. PiScan data shows that over the last 24 hours, CEXs' wallets recorded an inflow of 177,867 PI tokens, bringing the total balance to 437.88 million tokens.
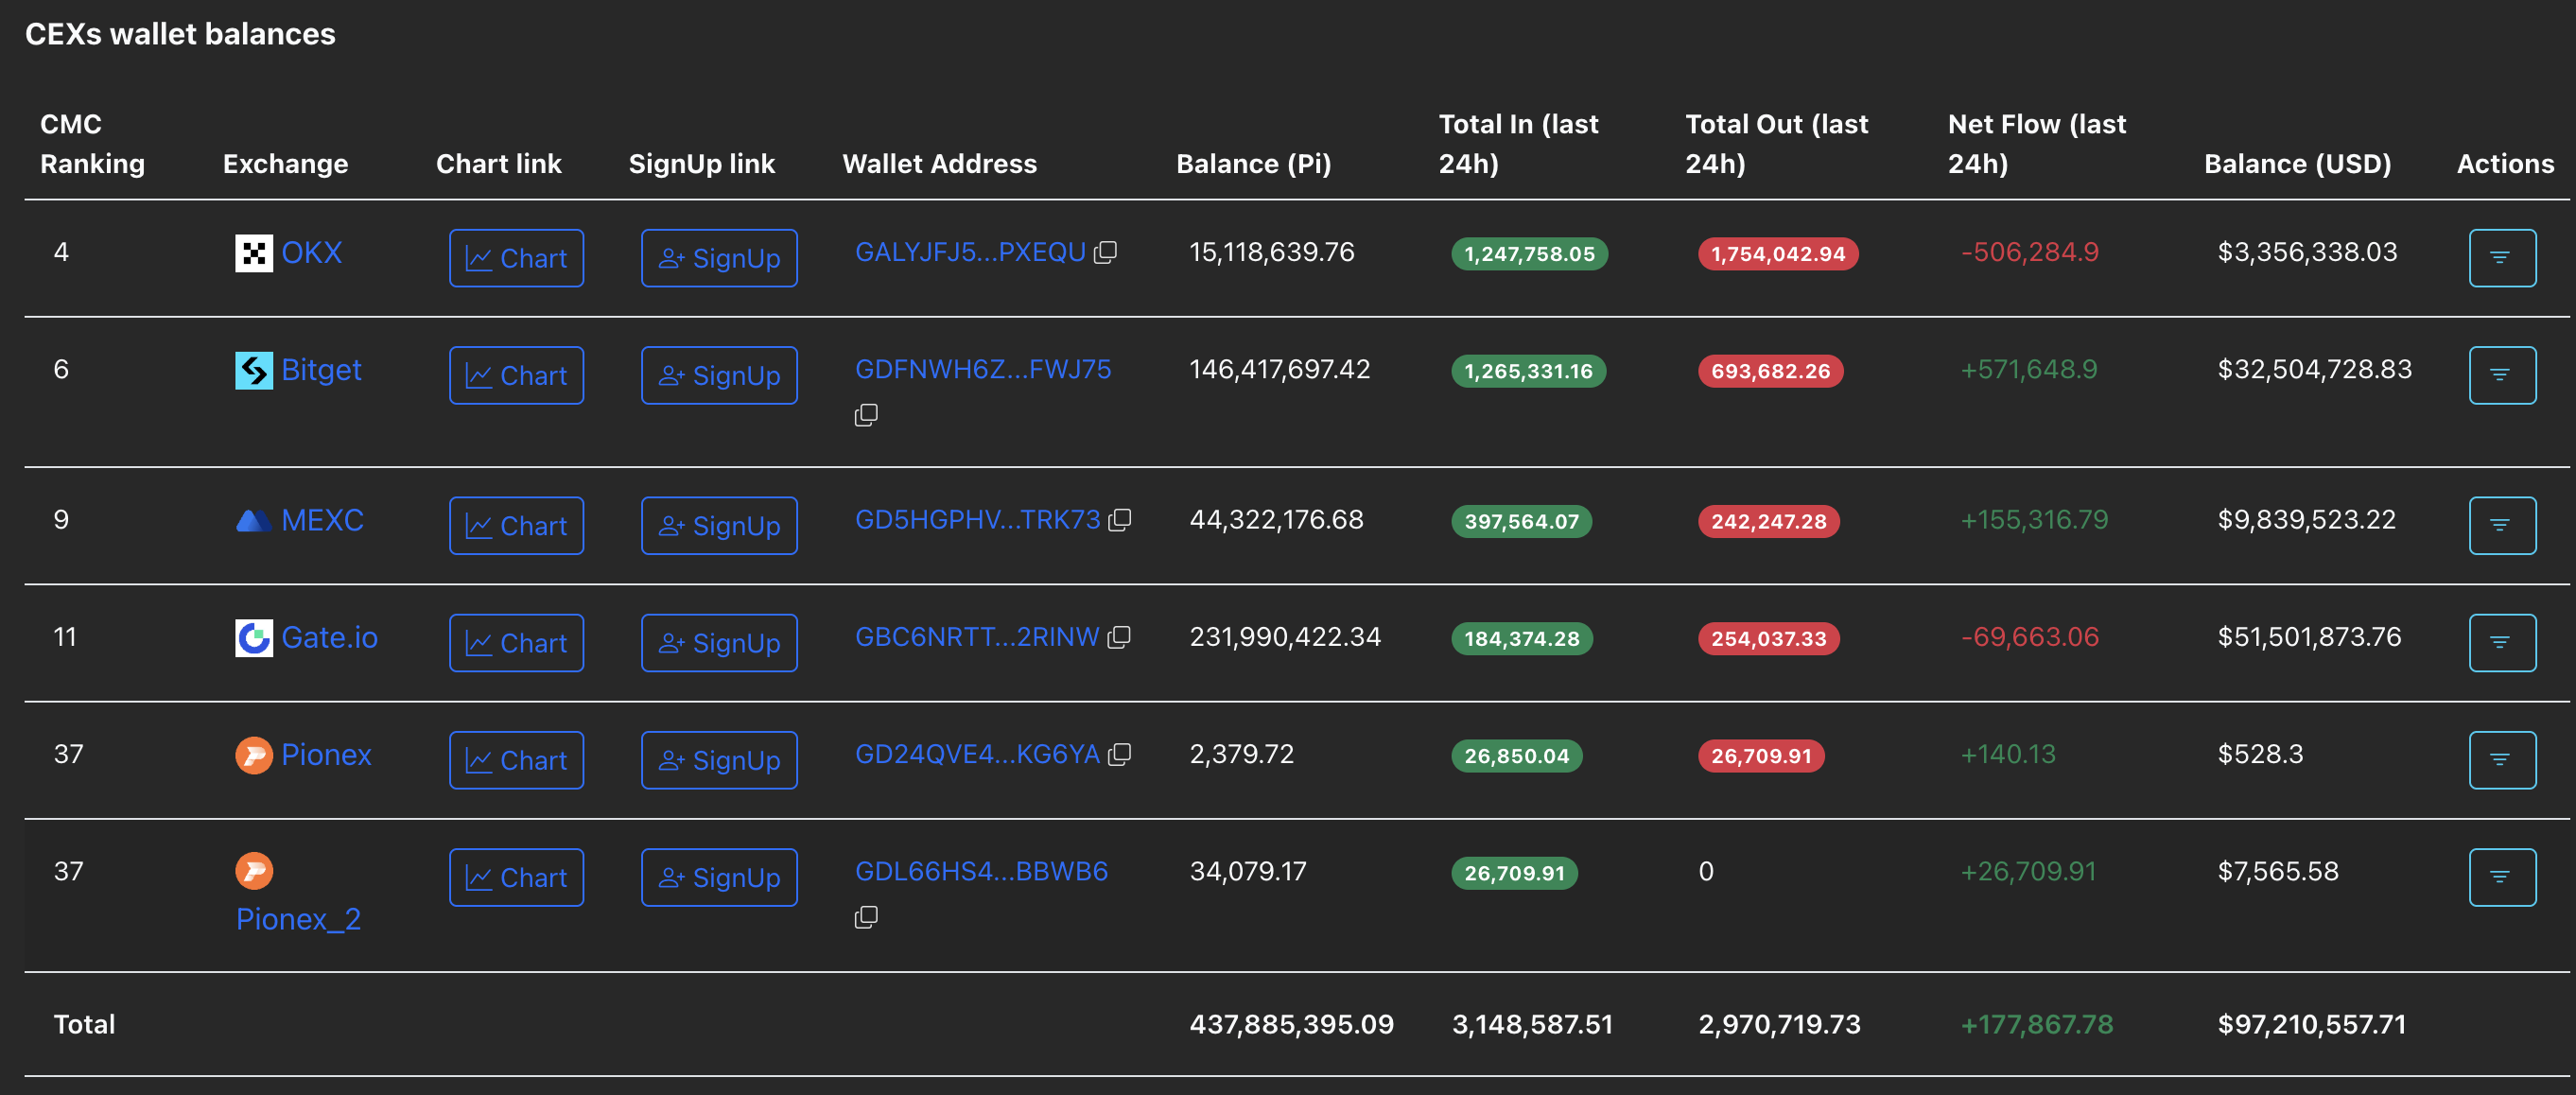
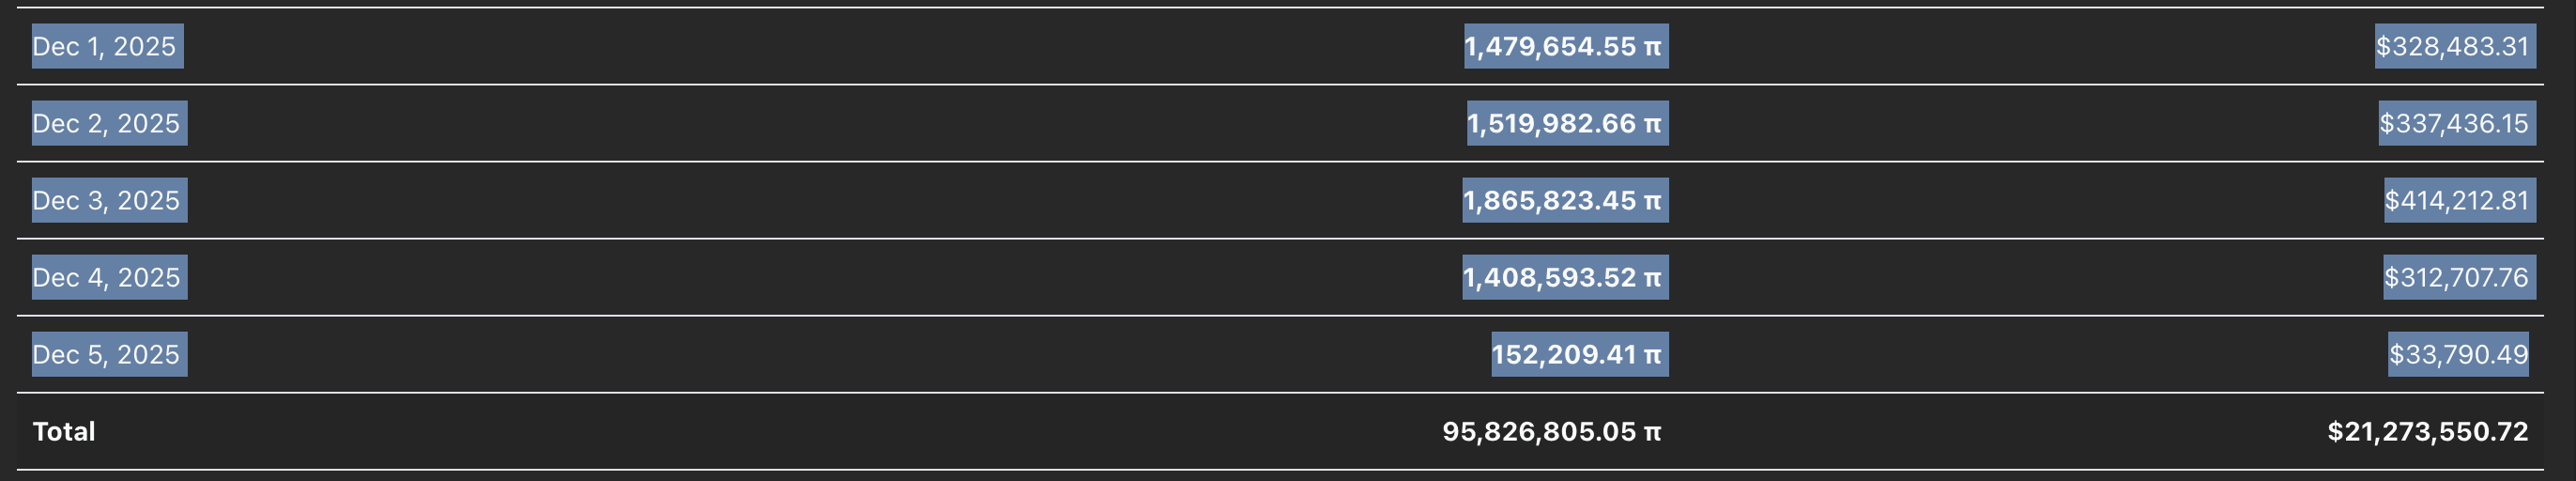
One of the key factors fueling the deposits is the token migration from Pi Network’s testnet to mainnet, as 17.5 million users complete Know Your Customer (KYC) verification. Furthermore, reports from Pi Network suggest that integrating AI into the KYC process has reduced the waiting period by 50%. According to PiScan, over 6.42 million PI tokens have been transferred to the mainnet so far in December.
If the network fails to drive demand for its token through real-world use cases, a decline in investor confidence could further fuel the current selling pressure.
Technical outlook: Looking at $0.1919
Pi Network holds broadly steady at press time on Monday, after a near 2% drop on Sunday. The path of least resistance for PI token targets $0.1919, marked by the October 11 low. If the token slips below this level, it could extend losses toward the record low of $0.1533 seen on October 10.
The technical indicators on the daily chart point to an increase in overhead pressure. The Relative Strength Index (RSI) at 43 is below the halfway line and slopes downward, suggesting bearish potential.
Meanwhile, the Moving Average Convergence Divergence (MACD) maintains a sell signal as the MACD and signal descend below the zero line.
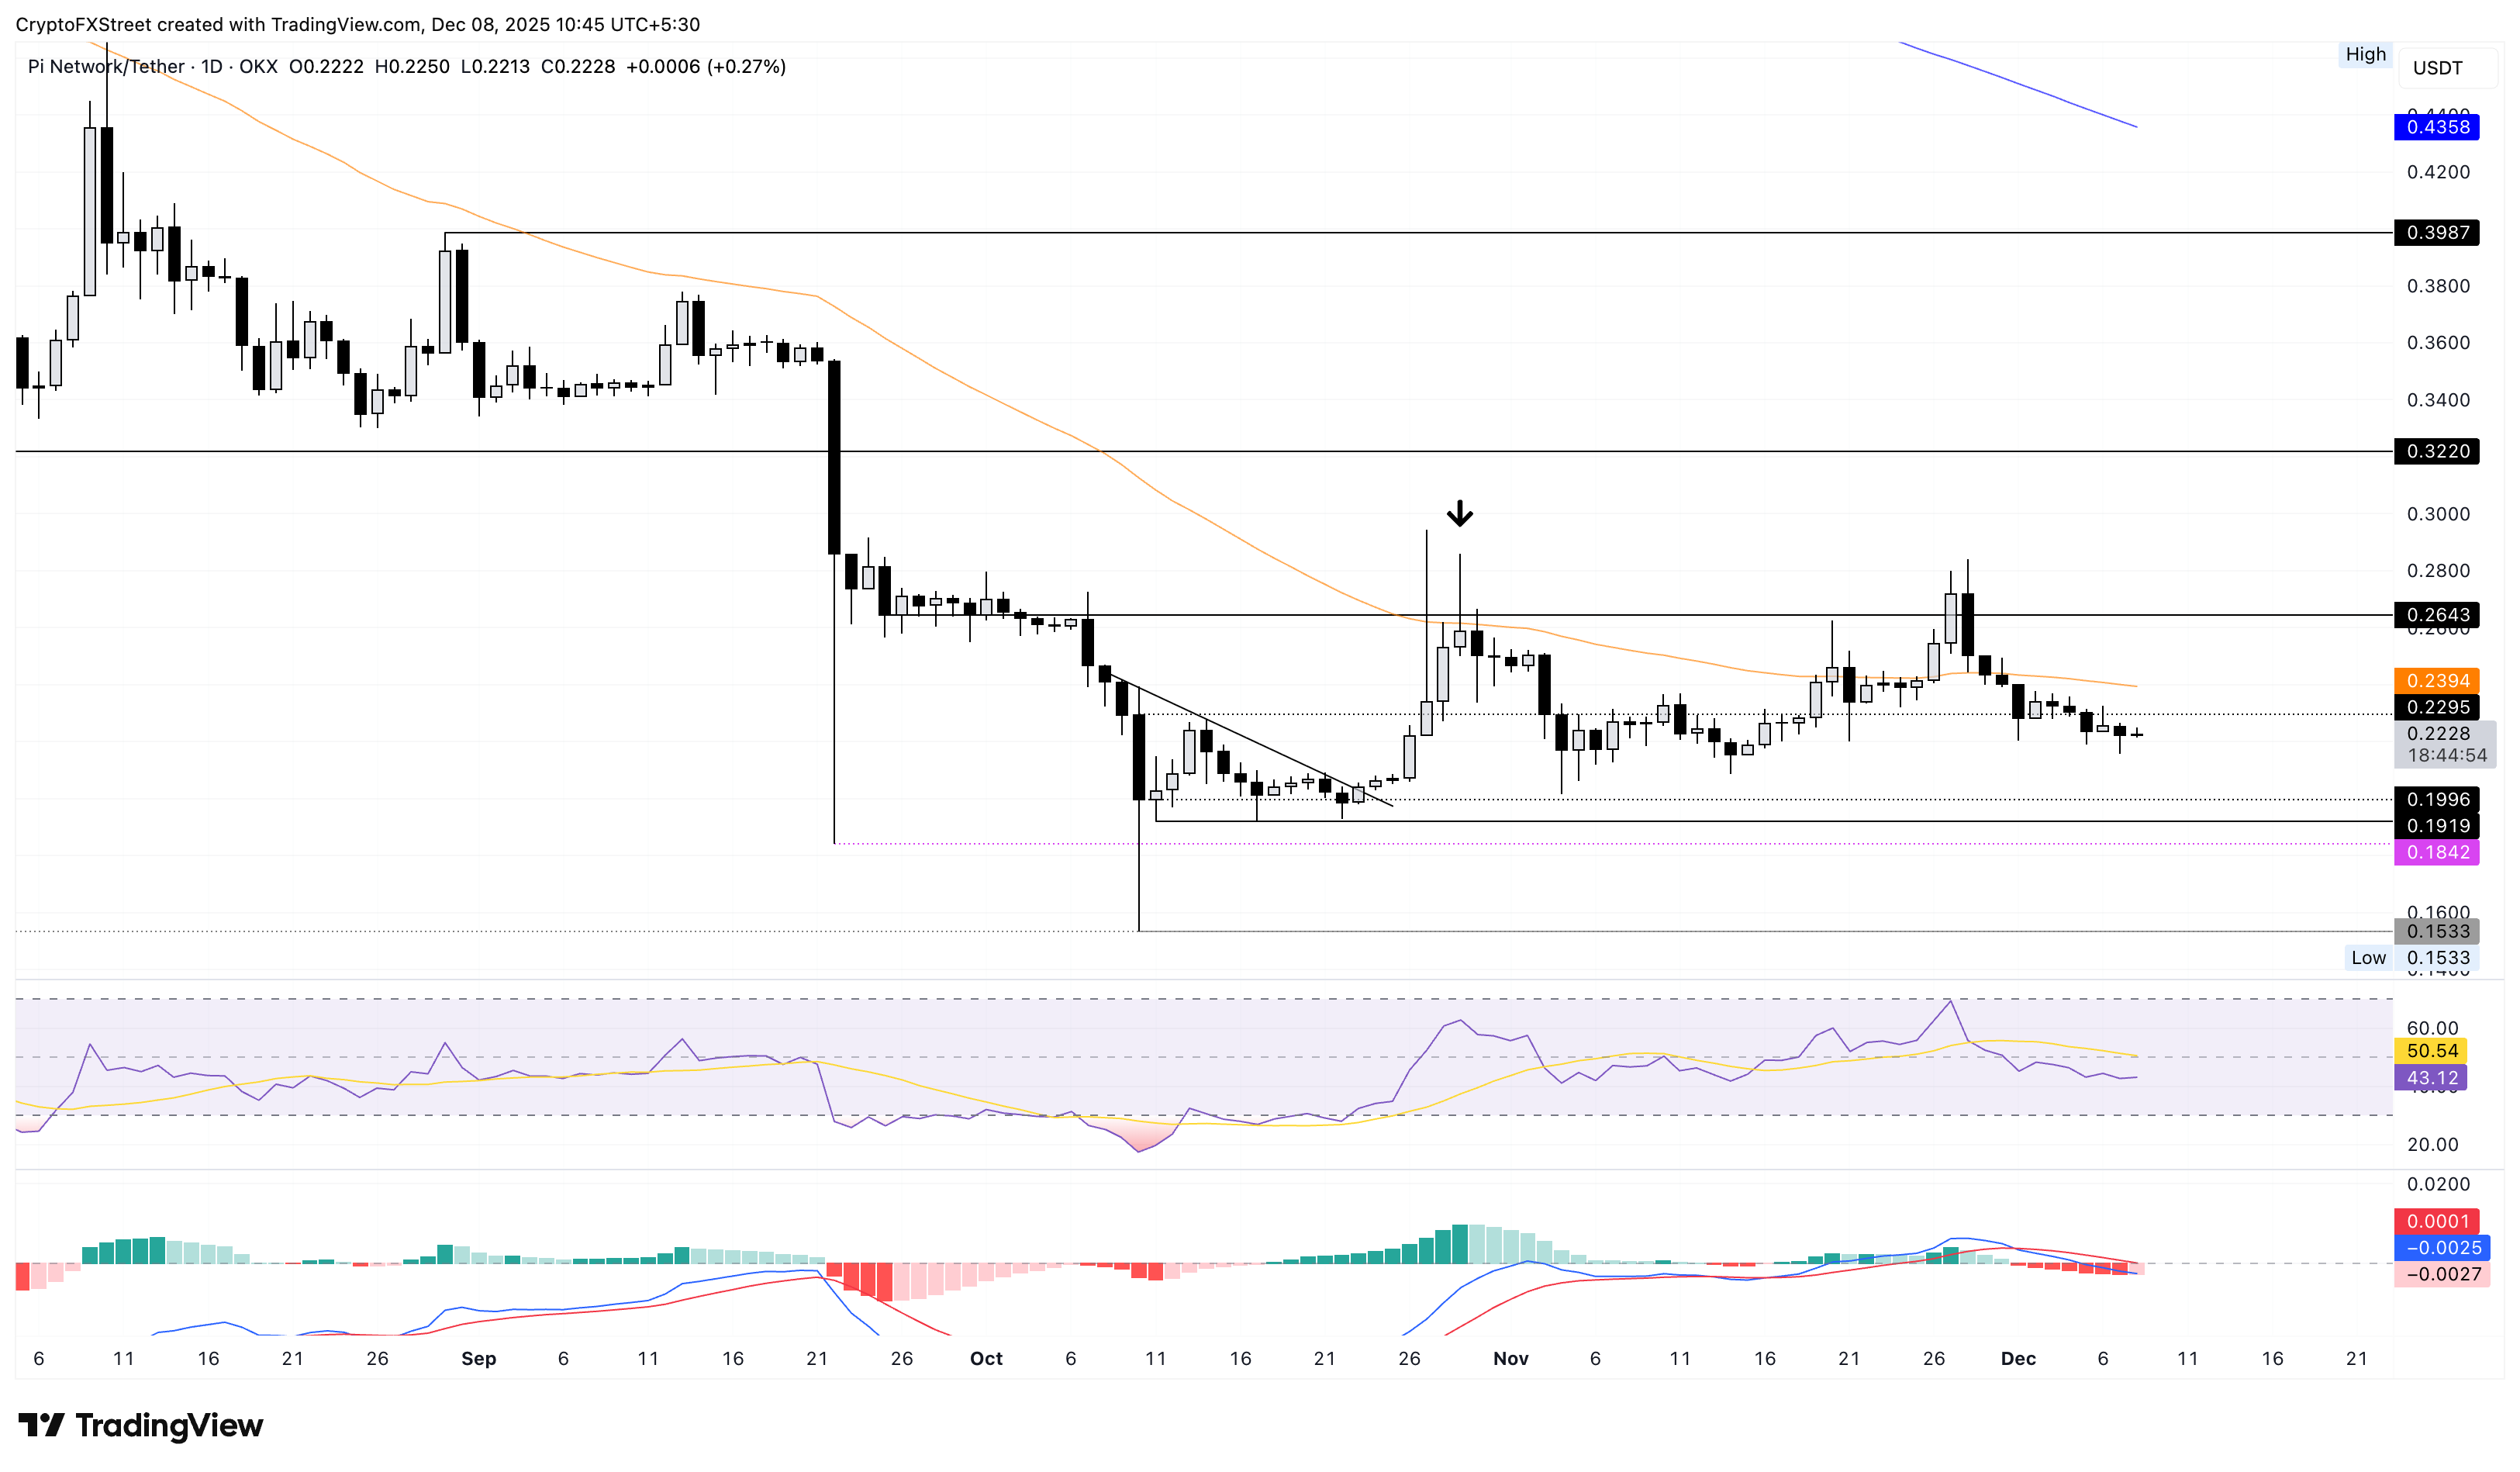
To reinstate an uptrend, the PI token should exceed the 50-day EMA at $0.2394.
Bitcoin, altcoins, stablecoins FAQs
Bitcoin is the largest cryptocurrency by market capitalization, a virtual currency designed to serve as money. This form of payment cannot be controlled by any one person, group, or entity, which eliminates the need for third-party participation during financial transactions.
Altcoins are any cryptocurrency apart from Bitcoin, but some also regard Ethereum as a non-altcoin because it is from these two cryptocurrencies that forking happens. If this is true, then Litecoin is the first altcoin, forked from the Bitcoin protocol and, therefore, an “improved” version of it.
Stablecoins are cryptocurrencies designed to have a stable price, with their value backed by a reserve of the asset it represents. To achieve this, the value of any one stablecoin is pegged to a commodity or financial instrument, such as the US Dollar (USD), with its supply regulated by an algorithm or demand. The main goal of stablecoins is to provide an on/off-ramp for investors willing to trade and invest in cryptocurrencies. Stablecoins also allow investors to store value since cryptocurrencies, in general, are subject to volatility.
Bitcoin dominance is the ratio of Bitcoin's market capitalization to the total market capitalization of all cryptocurrencies combined. It provides a clear picture of Bitcoin’s interest among investors. A high BTC dominance typically happens before and during a bull run, in which investors resort to investing in relatively stable and high market capitalization cryptocurrency like Bitcoin. A drop in BTC dominance usually means that investors are moving their capital and/or profits to altcoins in a quest for higher returns, which usually triggers an explosion of altcoin rallies.
추천 기사


