
WTI Crude Oil faces major resistance at $62.00
- WTI crude oil retreats below $62.00
- EIA report highlights increased supply, placing downside pressure on prices.
- Geopolitical risks, including US-Iran nuclear talks, remain a key focal point for oil prices.
Oil prices have been under persistent pressure since the inauguration of US President Donald Trump in January, weighed down by a combination of recession fears, rising global supply, and a softer US Dollar.
These factors have collectively contributed to renewed weakness in the liquid commodity, dampening the bullish momentum that previously supported elevated energy prices.
For West-Texas Intermediary (WTI) Crude Oil - the US benchmark extracted primarily from Texas and surrounding regions - prices found support late last year as global trade resumed and post-pandemic demand surged.
This resurgence helped lift energy prices through the final months of last year, particularly as supply remained constrained.
However, under the Trump administration, new energy policy priorities, which have included proposals to expand domestic oil production and ease environmental regulations, have shifted market expectations for long-term supply growth. These developments, coupled with lingering macroeconomic uncertainty and slowing growth in major economies, have altered the broader supply-demand outlook moving into mid-2025.
Adding to the downward pressure on crude, fresh data from the US Energy Information Administration (EIA) revealed a larger-than-expected build in domestic crude inventories, signaling potential demand weakness and reinforcing concerns about oversupply.
The rise in stockpiles comes amid ongoing increases in production from both non-OPEC players, including US shale, and OPEC+, which has recently confirmed plans to ramp up output to defend market share. These supply-side pressures have further weighed on WTI, now trading below $62 per barrel.
Despite known risks surrounding the oil market, including inflation sensitivity and fiscal spillovers, geopolitical developments remain a key wildcard.
On Wednesday, reports surfaced that Israel may be preparing potential strikes on Iranian nuclear facilities, briefly pushing prices higher before gains faded in the wake of bearish inventory data. The potential for escalation in the Middle East could reintroduce risk premiums, particularly if supply routes are disrupted, though for now, the market appears more focused on structural imbalances.
WTI rally runs out of fuel below $62.00
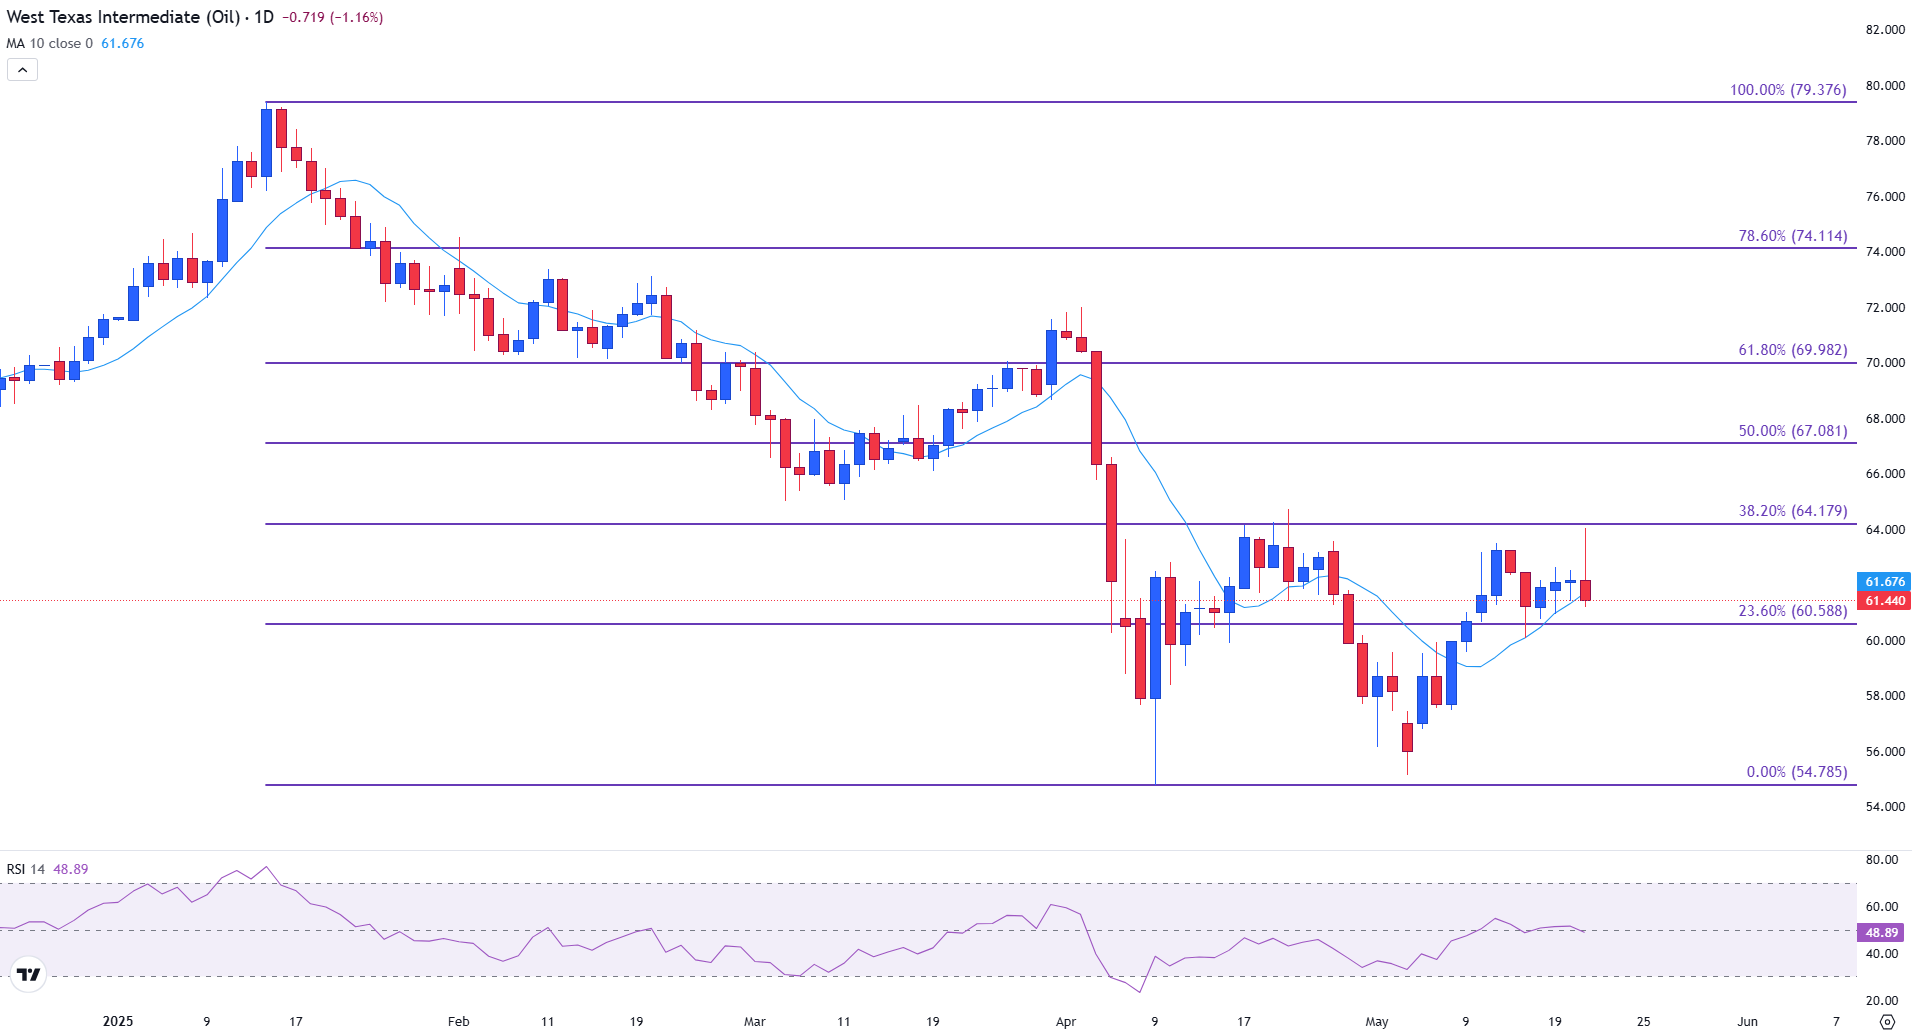
From a technical standpoint, WTI crude recently attempted to break above the 38.2% Fibonacci retracement level ($64.179) of the January–April YTD decline.
However, the rally was capped by strong selling pressure, forming a long upper wick on the daily candlestick, a classic sign of bullish exhaustion and a potential reversal point.
This reinforces the $64.00 region as key resistance, and unless buyers can regain control above this level, near-term price action may favor further consolidation or downside movement.
The 10-day Simple Moving Average (SMA) near $61.68 is acting as dynamic support, while a clean break lower could expose the next support zone at $60.58 (23.6% Fib).
WTI Crude Oil daily chart
WTI Oil FAQs
WTI Oil is a type of Crude Oil sold on international markets. The WTI stands for West Texas Intermediate, one of three major types including Brent and Dubai Crude. WTI is also referred to as “light” and “sweet” because of its relatively low gravity and sulfur content respectively. It is considered a high quality Oil that is easily refined. It is sourced in the United States and distributed via the Cushing hub, which is considered “The Pipeline Crossroads of the World”. It is a benchmark for the Oil market and WTI price is frequently quoted in the media.
Like all assets, supply and demand are the key drivers of WTI Oil price. As such, global growth can be a driver of increased demand and vice versa for weak global growth. Political instability, wars, and sanctions can disrupt supply and impact prices. The decisions of OPEC, a group of major Oil-producing countries, is another key driver of price. The value of the US Dollar influences the price of WTI Crude Oil, since Oil is predominantly traded in US Dollars, thus a weaker US Dollar can make Oil more affordable and vice versa.
The weekly Oil inventory reports published by the American Petroleum Institute (API) and the Energy Information Agency (EIA) impact the price of WTI Oil. Changes in inventories reflect fluctuating supply and demand. If the data shows a drop in inventories it can indicate increased demand, pushing up Oil price. Higher inventories can reflect increased supply, pushing down prices. API’s report is published every Tuesday and EIA’s the day after. Their results are usually similar, falling within 1% of each other 75% of the time. The EIA data is considered more reliable, since it is a government agency.
OPEC (Organization of the Petroleum Exporting Countries) is a group of 12 Oil-producing nations who collectively decide production quotas for member countries at twice-yearly meetings. Their decisions often impact WTI Oil prices. When OPEC decides to lower quotas, it can tighten supply, pushing up Oil prices. When OPEC increases production, it has the opposite effect. OPEC+ refers to an expanded group that includes ten extra non-OPEC members, the most notable of which is Russia.
추천 기사


