
Australian Dollar holds ground following release of S&P PMI data
- The Australian Dollar remains stronger as the US Dollar weakens on Thursday.
- Australia’s Manufacturing PMI remains steady at 51.7 in May, meanwhile, Services PMI declines to 50.5.
- Fed officials noted that a decline in consumer and corporate confidence is attributed to US trade policy change.
The Australian Dollar (AUD) gains ground against the US Dollar (USD) on Thursday, extending its gains for the second successive day. The AUD/USD pair maintains its position following the release of the preliminary S&P Global Purchasing Managers Index (PMI) data.
Australia's Manufacturing Purchasing Managers Index came in at 51.7 in May versus 51.7 prior. Meanwhile, Services PMI declines to 50.5 in May from the previous reading of 51.0, while the Composite PMI eases to 50.6 in May versus 51.0 prior.
The Reserve Bank of Australia (RBA) reduced its Official Cash Rate (OCR) by 25 basis points on Tuesday. Moreover, RBA Governor Michele Bullock supported the central bank's rate cut decision. Bulock noted that curbing inflation is important and expressed that a rate cut was a proactive, confidence-boosting move that was suitable given the state of the economy. She also mentioned that the Board is prepared to take additional action if necessary, raising the prospect of future changes.
Australian Dollar maintains position as US Dollar continues to weaken
- The US Dollar Index (DXY), which tracks the US Dollar (USD) against a basket of six major currencies, is losing ground for the fourth successive session and trading lower at around 99.50 at the time of writing.
- Cleveland Fed President Beth Hammack and San Francisco Fed President Mary C. Daly both voiced rising concerns about the US economy during a panel event organized by the Federal Reserve Bank of Atlanta. Despite the fact that important economic indicators are still strong, both officials noted a decline in consumer and corporate confidence and partially blamed the change in opinion on US trade policies.
- On Tuesday, Atlanta Fed President Raphael Bostic expanded on remarks he made the previous day. Bostic warned that the inconsistent and shifting tariff policies introduced during the Trump administration risk disrupting US trade logistics, which are heavily dependent on large-scale imports to satisfy domestic demand.
- The US Dollar struggles after Moody’s downgraded the US credit rating from Aaa to Aa1. This move aligns with similar downgrades by Fitch Ratings in 2023 and Standard & Poor’s in 2011. Moody’s now projects US federal debt to climb to around 134% of GDP by 2035, up from 98% in 2023, with the budget deficit expected to widen to nearly 9% of GDP. This deterioration is attributed to rising debt-servicing costs, expanding entitlement programs, and falling tax revenues.
- Economic data released last week pointed to easing inflation, as both the Consumer Price Index (CPI) and Producer Price Index (PPI) signaled a deceleration in price pressures. This has heightened expectations that the Federal Reserve may implement additional rate cuts in 2025, contributing to further weakness in the US Dollar. Additionally, disappointing US Retail Sales figures have deepened concerns over an extended period of sluggish economic growth.
- On Wednesday, China’s Commerce Ministry stated that US measures on China’s advanced chips are ‘typical of unilateral bullying and protectionism.’ Chinese authorities are looking further into whether the United States is serious about correcting its erroneous practices.
- The PBoC announced a reduction in its Loan Prime Rates (LPRs) on Tuesday. The one-year LPR was lowered from 3.10% to 3.00%, while the five-year LPR was reduced from 3.60% to 3.50%.
- The risk-sensitive Australian Dollar gained support from renewed optimism surrounding a 90-day US-China trade truce and hopes for further trade deals with other countries. Meanwhile, US Treasury Secretary Scott Bessent told CNN on Sunday that President Donald Trump intends to implement tariffs at previously threatened levels on trading partners that do not engage in negotiations “in good faith.”
- The AUD was also affected by Australia's political unrest. Following the National Party's withdrawal from its collaboration with the Liberal Party, the opposition coalition disbanded. The ruling Labor Party, meanwhile, took advantage of the unrest and retook power with a more robust and expansive agenda.
Australian Dollar remains within a confined range despite a bullish bias
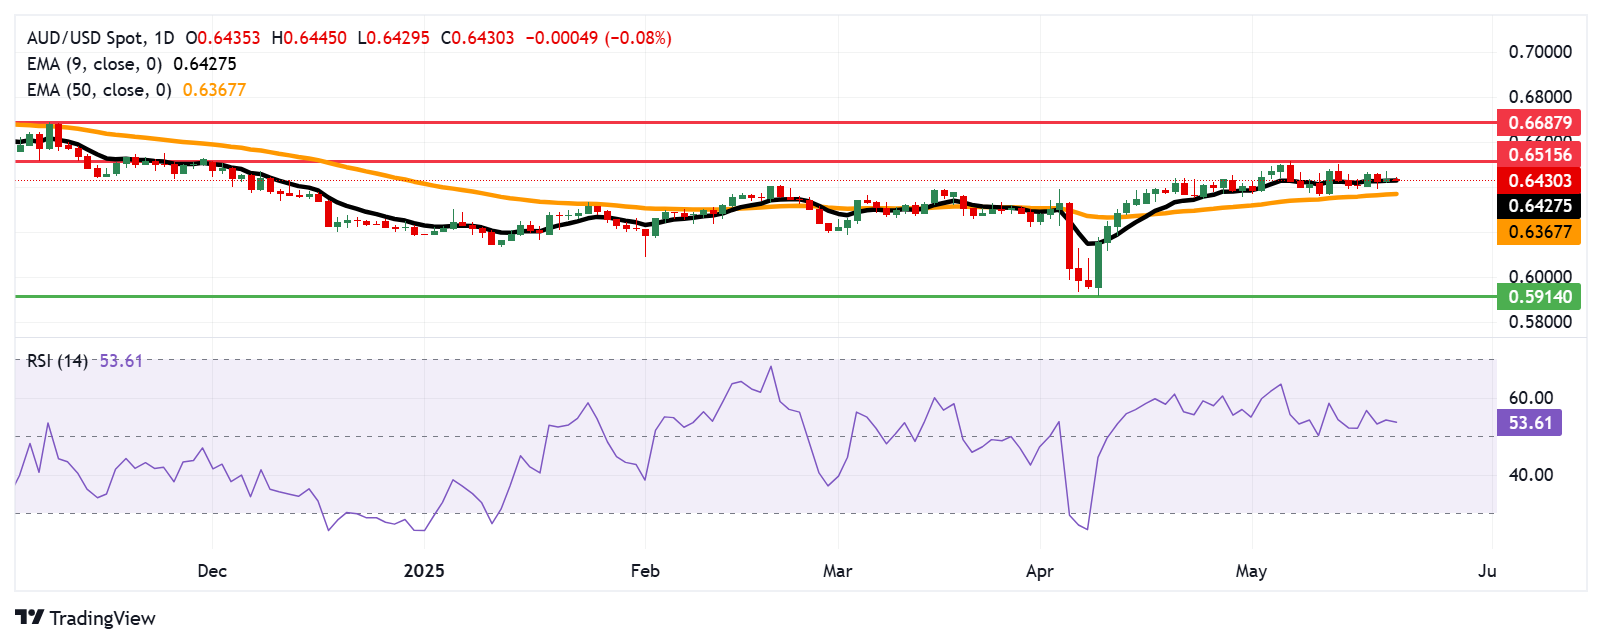
The AUD/USD pair is trading around 0.6440 on Thursday. The daily technical indicators reflect a bullish tone as the pair maintains its position above the nine-day Exponential Moving Average (EMA), while the 14-day Relative Strength Index (RSI) stays above the neutral 50 level, both supporting persistent upward momentum.
The immediate resistance appears at the six-month high of 0.6515, recorded on December 2, 2024. A decisive break above this barrier could pave the way for a test of the seven-month high at 0.6687, which was reached in November 2024.
On the downside, the nine-day EMA of 0.6427 acts as an immediate support, followed by the 50-day EMA near 0.6367. Further depreciation would undermine the short- to medium-term bullish outlook, possibly opening the path toward the March 2020 low of 0.5914.
AUD/USD: Daily Chart
Australian Dollar PRICE Today
The table below shows the percentage change of Australian Dollar (AUD) against listed major currencies today. Australian Dollar was the strongest against the New Zealand Dollar.
| USD | EUR | GBP | JPY | CAD | AUD | NZD | CHF | |
|---|---|---|---|---|---|---|---|---|
| USD | -0.00% | -0.02% | -0.22% | 0.00% | 0.09% | 0.23% | -0.05% | |
| EUR | 0.00% | -0.01% | -0.21% | 0.00% | 0.10% | 0.24% | -0.05% | |
| GBP | 0.02% | 0.01% | -0.23% | 0.02% | 0.13% | 0.24% | -0.03% | |
| JPY | 0.22% | 0.21% | 0.23% | 0.23% | 0.33% | 0.43% | 0.15% | |
| CAD | -0.00% | -0.00% | -0.02% | -0.23% | 0.11% | 0.23% | -0.05% | |
| AUD | -0.09% | -0.10% | -0.13% | -0.33% | -0.11% | 0.13% | -0.16% | |
| NZD | -0.23% | -0.24% | -0.24% | -0.43% | -0.23% | -0.13% | -0.29% | |
| CHF | 0.05% | 0.05% | 0.03% | -0.15% | 0.05% | 0.16% | 0.29% |
The heat map shows percentage changes of major currencies against each other. The base currency is picked from the left column, while the quote currency is picked from the top row. For example, if you pick the Australian Dollar from the left column and move along the horizontal line to the US Dollar, the percentage change displayed in the box will represent AUD (base)/USD (quote).
Economic Indicator
S&P Global Manufacturing PMI
The Manufacturing Purchasing Managers Index (PMI), released on a monthly basis by S&P Global, is a leading indicator gauging business activity in Australia’s manufacturing sector. The data is derived from surveys of senior executives at private-sector companies. Survey responses reflect the change, if any, in the current month compared to the previous month and can anticipate changing trends in official data series such as Gross Domestic Product (GDP), industrial production, employment and inflation. The index varies between 0 and 100, with levels of 50.0 signaling no change over the previous month. A reading above 50 indicates that the manufacturing economy is generally expanding, a bullish sign for the Australian Dollar (AUD). Meanwhile, a reading below 50 signals that activity among goods producers is generally declining, which is seen as bearish for AUD.
Read more.Last release: Wed May 21, 2025 23:00 (Prel)
Frequency: Monthly
Actual: -
Consensus: -
Previous: 51.7
Source: S&P Global
the
추천 기사


