
US Dollar weakens for third straight day as US fiscal concerns linger
- The US Dollar Index slips for a third consecutive day despite the uptick in geopolitical uncertainty.
- Israel’s reported plans to target Iranian nuclear facilities raise doubts among traders about Trump’s ability to handle tensions in the Middle East..
- The US Dollar Index slips below 100.00 as it ekes out further losses.
The US Dollar Index (DXY), which tracks the performance of the US Dollar (USD) against six major currencies, slips for a third consecutive day on Wednesday as markets brace for another playing field of geopolitical tensions. Throughout the week, the USD has already paid the price for the volatile policy swings from the Trump administration, which is facing difficulties on several fronts.
US President Trump apparently no longer has firm control over Israel’s Prime Minister Benjamin Netanyahu. In his tour of the Middle East, Trump announced it was time for a new nuclear deal with Iran and a second chance. However, in late trading hours on Tuesday, CNN reported that Israel considers striking nuclear installations in Iran – something that former President Joe Biden was able to avoid –, and undoes President Trump’s diplomatic efforts from the past few days in the region.
The second front is domestic, with another failure for what Trump calls the “Big Beautiful Bill”. Trump got frustrated with demands to significantly boost the cap on the state and local tax (SALT) deduction, signaling a deadlock in passing a giant tax-cut bill. Trump told lawmakers not to let the SALT deduction or differences over social safety-net cuts impede the bill, but lawmakers from high-tax states and conservative hardliners are still opposed to the bill unless their changes are made, Bloomberg reports.
Daily digest market movers: More of the same
- The weekly Mortgage Applications fell by -5.1% against the previous number at a 1.1% increase the week before.
- Around 16:15 GMT, Federal Reserve Bank (Fed) of Richmond President Thomas Barkin will hold a speech with possible market comments. Fed’s Barkin already spoke earlier this week, saying that it will take several months, even into the summer, before the economic situation and US data stabilizes.. Fed Governor Michelle Bowman will also participate in the event.
- Equities are on the backfoot with US futures are in the red by more than 0.50%.
- The CME FedWatch tool shows the chance of an interest rate cut by the Federal Reserve in June’s meeting at just 5.4%. Further ahead, the July 30 decision sees odds for rates being lower than current levels at 26.9%. Recent hawkish comments from Fed officials have reduced the chances of a rate cut in the short term.
- The US 10-year yields trade around 4.53%, cooling down from the steep rally seen on Monday.
US Dollar Index Technical Analysis: Could get worse
The US Dollar Index is cracking under pressure and is starting to look very bleak. In early Wednesday trading, the DXY extended losses below the 100.00 threshold after closing below the substantial floor at 100.22 the previous day, which could lead the index to make a nosedive move. With the recent geopolitical headlines, traders are coming more and more to the conclusion that President Trump might face several substantial setbacks in his term and policy implementation.
On the upside, the broken ascending trend line and the 100.22 level, which held the DXY back in September-October, are the first resistance zone. Further up, 101.90 is the next big resistance again as it already acted as a pivotal level throughout December 2023 and as a base for the inverted head-and-shoulders (H&S) formation during the summer of 2024. The 55-day Simple Moving Average (SMA) at 101.94 reinforces this area as strong resistance. In case Dollar bulls push the DXY even higher, the 103.18 pivotal level comes into play.
If the downward pressure continues, a nosedive move could materialize towards the year-to-date low of 97.91 and the pivotal level of 97.73. Further below, a relatively thin technical support comes in at 96.94 before looking at the lower levels of this new price range. These would be at 95.25 and 94.56, meaning fresh lows not seen since 2022.
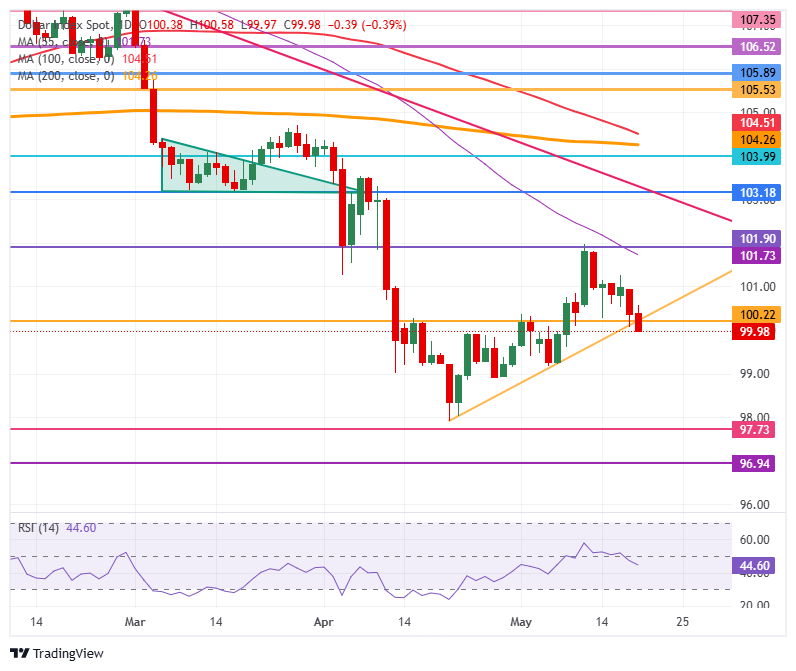
US Dollar Index: Daily Chart
US Dollar FAQs
The US Dollar (USD) is the official currency of the United States of America, and the ‘de facto’ currency of a significant number of other countries where it is found in circulation alongside local notes. It is the most heavily traded currency in the world, accounting for over 88% of all global foreign exchange turnover, or an average of $6.6 trillion in transactions per day, according to data from 2022. Following the second world war, the USD took over from the British Pound as the world’s reserve currency. For most of its history, the US Dollar was backed by Gold, until the Bretton Woods Agreement in 1971 when the Gold Standard went away.
The most important single factor impacting on the value of the US Dollar is monetary policy, which is shaped by the Federal Reserve (Fed). The Fed has two mandates: to achieve price stability (control inflation) and foster full employment. Its primary tool to achieve these two goals is by adjusting interest rates. When prices are rising too quickly and inflation is above the Fed’s 2% target, the Fed will raise rates, which helps the USD value. When inflation falls below 2% or the Unemployment Rate is too high, the Fed may lower interest rates, which weighs on the Greenback.
In extreme situations, the Federal Reserve can also print more Dollars and enact quantitative easing (QE). QE is the process by which the Fed substantially increases the flow of credit in a stuck financial system. It is a non-standard policy measure used when credit has dried up because banks will not lend to each other (out of the fear of counterparty default). It is a last resort when simply lowering interest rates is unlikely to achieve the necessary result. It was the Fed’s weapon of choice to combat the credit crunch that occurred during the Great Financial Crisis in 2008. It involves the Fed printing more Dollars and using them to buy US government bonds predominantly from financial institutions. QE usually leads to a weaker US Dollar.
Quantitative tightening (QT) is the reverse process whereby the Federal Reserve stops buying bonds from financial institutions and does not reinvest the principal from the bonds it holds maturing in new purchases. It is usually positive for the US Dollar.
추천 기사


