


CoreWeave vs. Nebius: Which Artificial Intelligence (AI) Stock Will Deliver Bigger Gains by 2028?
Key Points
Nebius and CoreWeave are capitalizing on the strong demand for AI computing capacity.
Both companies are charging customers higher rents and are focused on funding infrastructure development through internal sources and customer prepayments.
CoreWeave and Nebius have multibagger potential, making them solid buys following their recent slide.
- 10 stocks we like better than CoreWeave ›
Neocloud providers CoreWeave (NASDAQ:CRWV) and Nebius Group (NASDAQ:NBIS) have been growing at a phenomenal pace thanks to their business model of renting out dedicated artificial intelligence (AI) data center capacity. However, the market has been skeptical about their prospects.
This explains why both Nebius and CoreWeave have pulled back substantially over the past six months. CoreWeave stock has lost 54% of its value during this period, while Nebius is down 46%. However, the market seems to be underestimating the potential of both AI infrastructure stocks.
Missed Nvidia in 2009? This Rare Signal Is Flashing Again. In 2009, a "Double Down" signal flashed for a little-known chipmaker called Nvidia. For the first time in years, that same "Total Conviction" signal is flashing for a company 1/100th the size of Nvidia. Continue »
We will closely examine the financial performance, prospects, and valuations of both companies in this article to see how much upside they can deliver over the next couple of years.

Image source: The Motley Fool.
CoreWeave and Nebius are making the right moves to reduce balance sheet strain
The primary reason Nebius and CoreWeave have dropped sharply in recent months is concerns that they are taking on significant debt to build AI data centers. However, both companies are now taking smart steps to ensure that they can continue their build-out while keeping debt under control.
CoreWeave, for instance, is collecting advance payments from customers to avoid taking on unsecured debt and reduce the cost of financing. The company points out that it has "collected prepayments on 70% of our deals with customers funding up to 100% of the contract value upfront" so far in 2026.
CoreWeave is now in a position to fund the majority of its 2027 capital expenditure internally and through customer prepayments. The company believes that it will raise only "a limited amount" of capital through debt or equity.
Nebius has adopted a similar approach. The company notes that "prepayments on new contracts now cover more than 100% of the capital needed to bring this contracted capacity online." That's an improvement over the 50%-60% prepayment coverage that Nebius witnessed in the second quarter. The increase in prepayments has reduced the payback time for Nebius' capital investments by three months to 1 year and seven months.
The company says that its customers are "paying more, they pay earlier and they're committing for longer, and we are getting our capital back faster." Even better, the company expects $17 billion to $20 billion in customer prepayments next year, covering a large chunk of its estimated capex of $40 billion to $45 billion.
Additionally, both CoreWeave and Nebius are charging customers higher rents, benefiting from strong demand and tight supply of AI data center capacity. CoreWeave, for example, is charging $40 million per megawatt (MW) per year for short-term contracts, well above the $20 million to $25 million per MW per year it charges for long-term contracts.
Nebius is also charging higher prices, with the average annual price per MW increasing to more than $25 million last quarter, up from the earlier range of $20 million to $25 million. So, it is easy to see why the investment payback periods for both companies are shortening.
What's more, both companies have a solid backlog that should sustain healthy revenue growth over the next couple of years, paving the way for further upside in their stock prices.
Which stock is the better buy right now?
CoreWeave is a much larger company than Nebius. CoreWeave's Q3 revenue increased by 168% year over year last quarter to $3.66 billion. What's more, the company finished the quarter with a revenue backlog of $132.5 billion, up by 138% from the prior year.
Nebius, meanwhile, reported a much stronger increase of 571% in revenue to $981 million in Q3. The important thing to note is that Nebius has received more than $12 billion in new contracts since the beginning of Q3. This explains why the company expects a 4x increase in revenue in 2027 to $12 billion to $13 billion.
In fact, both companies are poised to deliver red-hot growth through 2028.
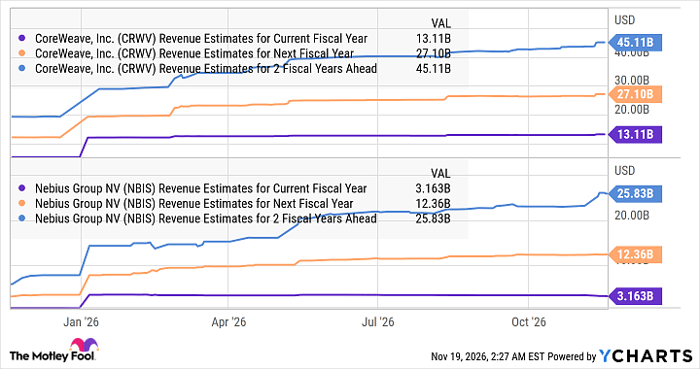
CRWV Revenue Estimates for Current Fiscal Year data by YCharts
However, the chart above clearly tells us that Nebius is on track to grow significantly faster than CoreWeave. So, Nebius looks like the ideal growth stock to buy for the next two years, though potential investors shouldn't forget that it trades at a significant premium to CoreWeave.
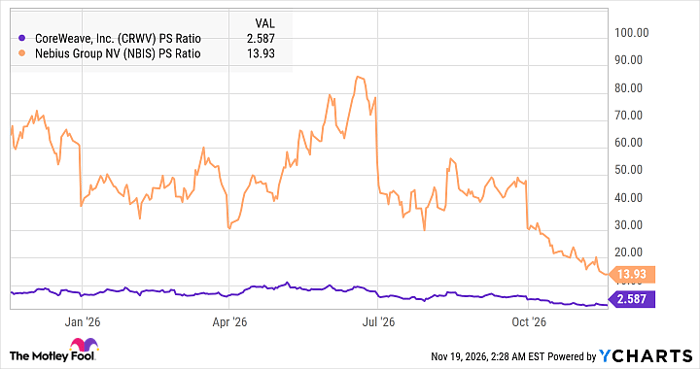
CRWV PS Ratio data by YCharts
The U.S. tech sector has an average price-to-sales ratio of 6.5. Assuming a similar multiple for CoreWeave at the end of 2028 points to a market cap of $292.5 billion (based on the $45 billion 2028 estimate), a potential jump of almost 11x from the current market cap. Applying a similar sales multiple to Nebius' 2028 revenue estimate suggests a market cap of $170 billion in two years, implying a 5.5x increase from current levels.
So, both Nebius and CoreWeave can become multibaggers by 2028, and investors can consider buying either of these two stocks based on their risk profile and how much valuation they are willing to pay.
Should you buy stock in CoreWeave right now?
Before you buy stock in CoreWeave, consider this:
The Motley Fool Stock Advisor analyst team just identified what they believe are the 10 best stocks for investors to buy now… and CoreWeave wasn’t one of them. The 10 stocks that made the cut could produce monster returns in the coming years.
Consider when Netflix made this list on December 17, 2004... if you invested $1,000 at the time of our recommendation, you’d have $322,605!* Or when Nvidia made this list on April 15, 2005... if you invested $1,000 at the time of our recommendation, you’d have $927,581!*
Now, it’s worth noting Stock Advisor’s total average return is 790% — a market-crushing outperformance compared to 202% for the S&P 500. Don't miss the latest top 10 list, available with Stock Advisor, and join an investing community built by individual investors for individual investors.
See the 10 stocks »
*Stock Advisor returns as of November 19, 2026.
Harsh Chauhan has no position in any of the stocks mentioned. The Motley Fool has no position in any of the stocks mentioned. The Motley Fool has a disclosure policy.
Recommended Articles


