


Nvidia Stock Price Forecast: Ahead of Q3 Earnings, Options Market Implies 8.5% Swing, Will It Hit $168 or $141?
TradingKey - Nvidia (NVDA) will report its fiscal 2027 third-quarter earnings after the U.S. market close on November 17. The options market expects a post-earnings price swing of up to 8.5%. Based on the current share price of around $150, this corresponds to an upside of approximately $168 and a downside of about $141.
Notably, Nvidia shares have fallen by a cumulative 38% since hitting an all-time high of $243.37 on October 6. Elevated valuations, policy risks, and concerns over the sustainability of AI capital expenditures make this earnings report a critical test of its growth prospects.
Revenue Expected at $109.3 Billion: How High Is the Bar to Beat?
The market expects revenue of $109.3 billion this quarter, with data center revenue at $101.8 billion, representing sequential growth of approximately 14.4%. The company previously guided for revenue of $108.0 billion, plus or minus 2%, leaving market expectations less than 1% below the upper end of the guidance range at $110.16 billion.
This means that merely meeting company guidance may not be sufficient to drive a stock price rebound. Investors will need to see whether Blackwell can sustain its volume ramp, as well as the delivery cadence and supply chain execution during the transition to Vera Rubin.
Earnings quality is equally critical. The company's non-GAAP gross margin guidance for the quarter is 74%, down from 75% in the prior quarter. If revenue beats expectations and gross margin holds steady, it will help alleviate cost concerns; however, if margins decline further, whether high growth can translate into profit will remain in question.
CEO Transition, Next-Quarter Guidance More Critical
On November 12, Nvidia announced that Jensen Huang stepped down, with CFO Colette Kress appointed interim CEO while concurrently serving as CFO. This is the first earnings report following the transition, but as the quarter ended October 25, it primarily reflects prior operating performance.
The market is more focused on whether Kress can maintain the technology roadmap, customer relationships, and delivery commitments, as well as whether she will adjust financing support for AI customers. Tightening support could reduce financial risks, but it may also slow the expansion of some customers.
Therefore, reversing the weakness will require clearer signals of future growth. A rebound would have stronger support if next-quarter guidance is strong and order fulfillment remains steady; however, if management turns cautious on demand, the stock price could still come under pressure even if current-quarter revenue beats expectations.
Nvidia Technical Analysis: Two Potential Stock Price Paths Post-Earnings
From a technical perspective, Nvidia has broken below its prior low for the year ($164.27). The current price sits below all five exponential moving averages (EMAs), which remain in a complete bearish alignment. The daily chart is still in a phase of low-level consolidation following the breakdown, with no clear trend reversal yet established. Third-quarter earnings will serve as a key catalyst for the stock's short-term direction.
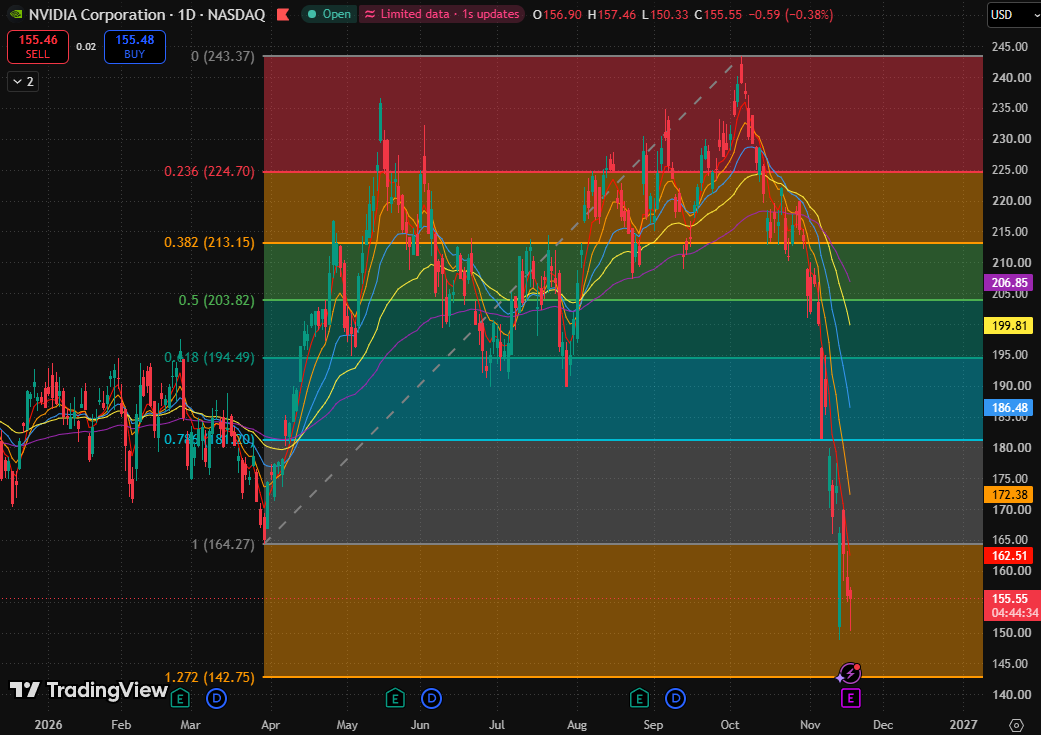
Nvidia daily chart, Source: TradingView
Scenario 1: Post-Earnings Rally to Around $168
If the stock rallies to $168 after earnings, it will cross above the 5-day exponential moving average ($162.23) and reclaim its prior spring low ($164.27). At that point, price action could shift from 'weak consolidation below the prior low' to an 'attempted rebound to reclaim the prior low'.
At $168.18, the stock is approximately $3.91, or roughly 2.38%, above $164.27, but it remains below the 10-day exponential moving average ($172.23) and the 20-day exponential moving average ($186.40). Therefore, while this advance would improve the short-term structure, it is not yet sufficient to overcome the overhead resistance from intermediate-term moving averages.
If the stock closes above $164.27 on the first full trading day after earnings, it would indicate that the prior low has been preliminarily reclaimed; a subsequent successful retest of this level without breaking down would make the recovery more sustainable. The next level to watch would be the 10-day exponential moving average ($172.23). If strength persists, attention would then turn to the resistance zone between the 0.786 Fibonacci retracement level ($181.20) and the 20-day exponential moving average ($186.40).
Scenario 2: Post-Earnings Decline to Around $141
If the stock drops to $141, it would break below the recent low zone near $150 and fall slightly below the 1.272 Fibonacci extension level ($142.75), indicating that the decline following the loss of the prior low is expanding further. Panic sentiment could potentially push Nvidia's stock down to the 1.618 Fibonacci extension level ($115.39).
Recommended Articles


