

Jensen Huang Abruptly Steps Down, Nvidia Pares 14% Intraday Plunge, Stock Seen Rebounding Toward $190

Source Tradingkey

TradingKey - On November 12, Eastern Time, Nvidia (NVDA) shares experienced sharp volatility following the sudden resignation of CEO Jensen Huang. NVDA gapped down sharply at the open and touched an intraday low of $148.80, down roughly 14% from the prior session at one point, before staging a marked rebound to ultimately close at $166.19, down 4.34%. Full-day trading volume reached approximately 748 million shares, expanding significantly from recent average levels.

Jensen Huang Departure Adds Management Uncertainty as Initial Panic Selling Partially Absorbed

On November 12, Nvidia officially announced that co-founder Jensen Huang resigned as president, CEO, and director, effective immediately. The company's current CFO, Colette Kress, has been named interim CEO, and the board has initiated a search process for a permanent CEO. Huang led Nvidia for over 30 years and spearheaded its transformation from a graphics chipmaker into a core global supplier of AI computing. Consequently, the impact of his sudden departure is primarily centered on management stability, product strategy continuity, and key customer relationships, rather than any sudden shift in current demand for Nvidia's AI chip business.

Judging from the stock price reaction, the initial wave of panic selling has clearly been absorbed, though it is not yet possible to determine whether the selling pressure has completely ended. NVDA dropped to as low as $148.80 at the open before rebounding over 11% from its low, ultimately narrowing its full-day decline to 4.34%. Meanwhile, Reuters, citing data from Vanda Research, reported that retail investors net-bought approximately $111 million worth of Nvidia shares in the first half-hour of trading—a record level—while buy orders on the Fidelity platform were nearly five times sell orders by midday. This indicates that notable buying support emerged around $148 to $150.

However, the unusually heavy trading volume of 748 million shares also indicates that the market is still readjusting the risk premium following Huang's departure. Nvidia has yet to name a permanent CEO, and the company is also scheduled to report quarterly earnings next week. The market will need further confirmation on whether continuity will be maintained across the Blackwell and subsequent product roadmaps, data center demand, and the new management team's strategy.

Nvidia Stock Price Technical Analysis
nvda-aee4638d5a9d4c87a78543c14aadd52f

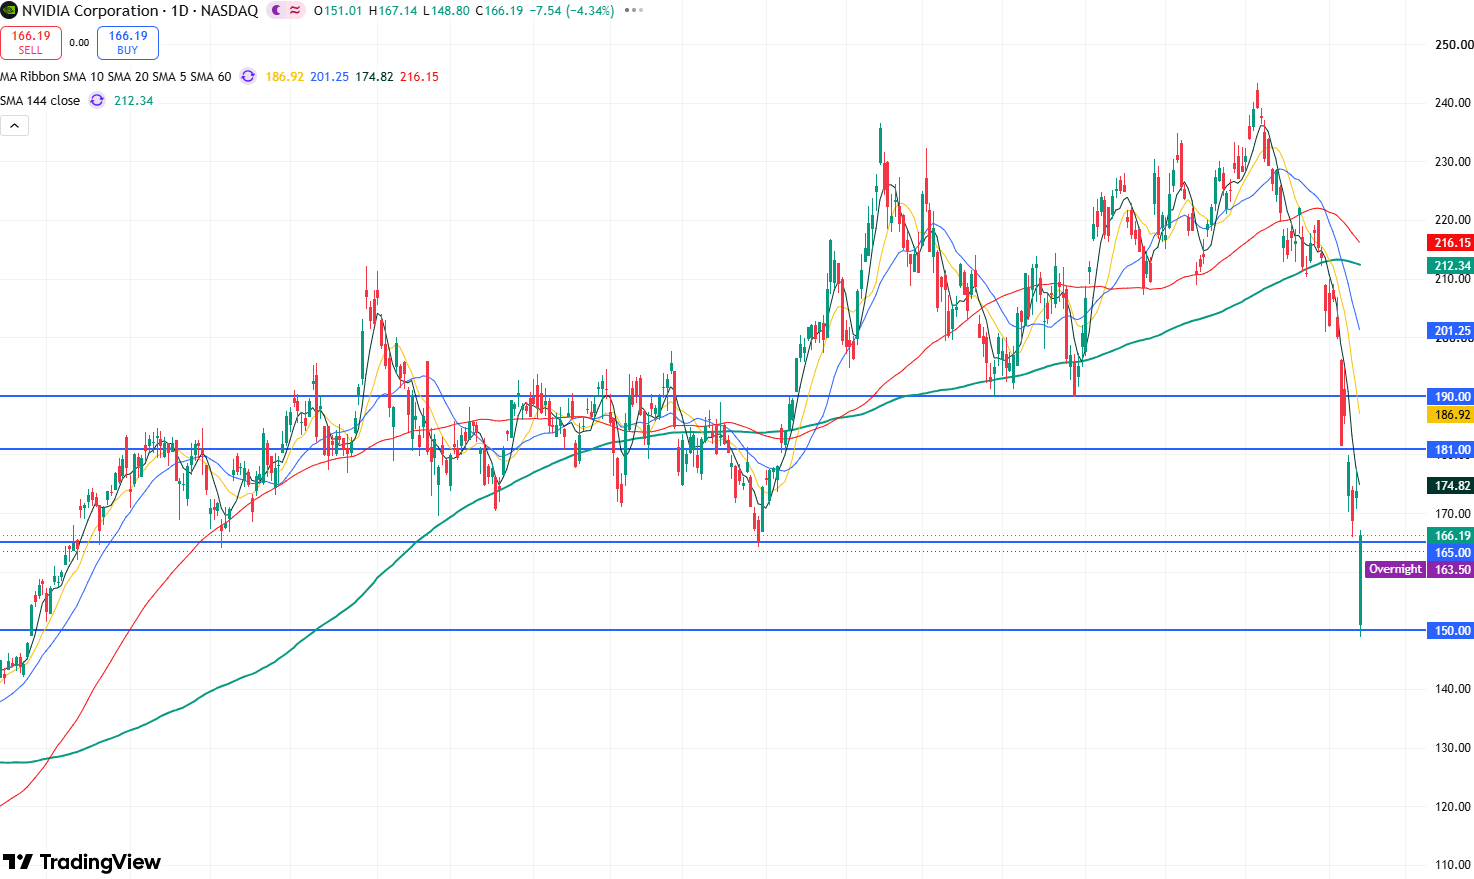
Nvidia stock daily chart, Source: TradingView

Looking at Nvidia's daily chart, the stock opened sharply lower at $151.01 on Thursday under pressure from the negative news of Jensen Huang's resignation, briefly falling below key support at $150 intraday. However, it quickly rebounded to recover most of its losses, indicating that market selling pressure has been somewhat absorbed, thereby supporting a stock rebound.

In terms of technical indicators, the Relative Strength Index (RSI) stands at 26.14, having entered oversold territory, which suggests that near-term downside room for the stock may be limited and that the probability of a rebound has significantly increased.

Currently, the stock has found support at the key $150 level and halted its decline, and it may see a short-term technical recovery rally. The primary upside target to watch is the $170 resistance level; a breakout above this level could drive a further advance toward key resistance at $190, and breaking and holding above $190 would likely restore its medium-term upward structure.

On the downside, the key support level to watch is $150. If this level is lost, the stock could slide further toward the support level near $130.

Disclaimer: For information purposes only. Past performance is not indicative of future results.
placeholder
Gold Price Analysis Today | Forex Gold Analysis | XAU/USD Analysis - November 11, 2026Get the latest gold price analysis, forex gold insights, and XAU/USD analysis for November 11, 2026. Read on for the details.
Author  Mitrade
Nov 11, Wed
Get the latest gold price analysis, forex gold insights, and XAU/USD analysis for November 11, 2026. Read on for the details.
placeholder
Nvidia slid 7.7% after hours while AMD and Broadcom rose — the AI trade changed hands, it didn't breakNvidia closed Wednesday at 173.73, up 2.87%, then fell as much as 8.1% to 159.44 after reports that its board was preparing for a possible leadership change. The same session, the Philadelphia Semiconductor Index rose 5.7% with all 30 components higher, CoreWeave jumped 24.7% on 168% revenue growth, and Micron added 11.9%. If AI demand were being repriced, AMD and Broadcom would not be bid. This is a governance discount on one name, and 204.54 — the 200-day average — is the level that settles it.
Author  Irene Q.
Nov 12, Thu
Nvidia closed Wednesday at 173.73, up 2.87%, then fell as much as 8.1% to 159.44 after reports that its board was preparing for a possible leadership change. The same session, the Philadelphia Semiconductor Index rose 5.7% with all 30 components higher, CoreWeave jumped 24.7% on 168% revenue growth, and Micron added 11.9%. If AI demand were being repriced, AMD and Broadcom would not be bid. This is a governance discount on one name, and 204.54 — the 200-day average — is the level that settles it.
placeholder
US October PPI Preview: Fed Rate Hike Expectations Rise, PPI May Be Key Variable; How Will US Stocks, Dollar, and Gold Move?On Friday (Nov. 13) Eastern Time, the U.S. will release the October Producer Price Index (PPI). Following the October CPI once again exceeding expectations, the market will look to the PP
Author  TradingKey
Nov 12, Thu
On Friday (Nov. 13) Eastern Time, the U.S. will release the October Producer Price Index (PPI). Following the October CPI once again exceeding expectations, the market will look to the PP
placeholder
Gold hit a one-year low while central banks bought 321 tonnes — the sellers were never the ones you thinkSpot gold closed at 3,876 on Thursday, down 2.8% and its lowest close in more than a year, with an intraday low near 3,852. The dollar is at a 19-month high of 103.21 and the 10-year yield is at 5.10%, so the price move is easy to explain. What is harder to explain is who sold: central banks bought 321 tonnes in Q3, the PBoC added for a 24th straight month, ETF holdings are near a record 4,256 tonnes, and roughly 95% of the futures selling came from non-reportable and sovereign-type accounts rather than hedge funds. This piece separates the two books that have to balance.
Author  Irene Q.
Yesterday 02: 40
Spot gold closed at 3,876 on Thursday, down 2.8% and its lowest close in more than a year, with an intraday low near 3,852. The dollar is at a 19-month high of 103.21 and the 10-year yield is at 5.10%, so the price move is easy to explain. What is harder to explain is who sold: central banks bought 321 tonnes in Q3, the PBoC added for a 24th straight month, ETF holdings are near a record 4,256 tonnes, and roughly 95% of the futures selling came from non-reportable and sovereign-type accounts rather than hedge funds. This piece separates the two books that have to balance.
placeholder
Brent rose 3.3% and US crude stocks built 4.66 million barrels in the same weekBrent January settled at 95.82, up 3.3%, and WTI at 88.74, up 2.55%, after the US signalled it would not pursue a deal with Iran and attacks on Gulf shipping continued. In the same week, EIA data showed US crude inventories rising 4.657 million barrels against expectations of a 1.1 million draw, with gasoline up another 1.799 million. OPEC output also rebounded 1.96 million barrels a day to 27.16 million in October, led by Saudi Arabia at 10.56 million. This piece separates the geopolitical premium from the physical balance and lays out where each side of the trade is anchored.
Author  Irene Q.
Yesterday 03: 06
Brent January settled at 95.82, up 3.3%, and WTI at 88.74, up 2.55%, after the US signalled it would not pursue a deal with Iran and attacks on Gulf shipping continued. In the same week, EIA data showed US crude inventories rising 4.657 million barrels against expectations of a 1.1 million draw, with gasoline up another 1.799 million. OPEC output also rebounded 1.96 million barrels a day to 27.16 million in October, led by Saudi Arabia at 10.56 million. This piece separates the geopolitical premium from the physical balance and lays out where each side of the trade is anchored.
goTop
quote