

Silver ETF vs. Silver Miners ETF: Which Has Held Up Better This Year?

Source The Motley Fool

Key Points

  • The Global X Silver Miners ETF is winning the gold medal over spot silver ETFs.

  • This year, that’s not saying much in a year that's been quite volatile.

  • Some market observers believe miners can continue outpacing ETFs linked to silver prices.

  • Motley Fool Issues Rare "Total Conviction" Buy Alert ›

Some commodity prices are soaring this year -- I'm looking at you, oil -- while other marquee commodities, namely gold, are sagging. Regarding the yellow metal and related exchange-traded funds (ETFs), these assets are slumping largely due to rising interest rates.

In simple terms, higher yields refresh bonds' income proposition, making gold and bullion-backed ETFs less appealing because those assets don't pay dividends or interest. Gold's woes are pertinent to investors considering silver and ETFs such as the iShares Silver Trust (NYSEMKT: SLV), as the two commodities are often highly correlated.

Missed AI’s "Act 1"? Act 2 Could Be 15x Bigger. Most investors think they missed the AI boat because they didn't buy Nvidia in 2005. But according to our analysts, we’re only at the end of "Act 1"—the R&D phase. "Act 2" is the global rollout. Continue »

A silver bull and bear.

A major spot silver ETF is in a bear market, but a miners-focused fund has some bullish traits. Image source: Getty Images.

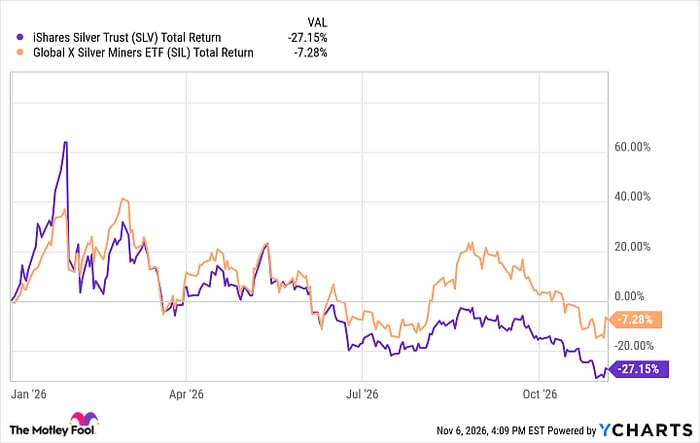
Compounding silver's 2026 woes is its reputation for overshooting gold moves for better or worse. This year, it's particularly bad, as the iShares ETF is off 27%, a loss more than 5 times that of SPDR Gold Shares (NYSEMKT: GLD). It's surprising that Global X Silver Miners ETF (NYSEMKT: SIL), the largest silver miners ETF, is performing significantly less poorly than its spot counterpart.

Sort of a gold medal

Based on a year-to-date loss of "just" 7.3%, the silver miners ETF wins out over its physically backed rivals, such as the iShares fund. That's nothing to write home about, but for investors evaluating silver ETFs as possible 2027 rebound candidates, the Global X fund's relative 2026 sturdiness may be instructive.

For starters, with inflation still running hot in the U.S. and the possibility that a change in control of Congress could lead to more government spending, the Federal Reserve may not cut interest rates anytime soon. Gold and silver could remain monetary policy stories, possibly weighing on funds such as the iShares ETF.

On the other hand, some experts believe that silver miners, including those held by the $3.9 billion Global X ETF, are poised to continue outperforming spot prices. Some of that thesis rests on the notion that miners don't necessarily need to hedge big moves in silver prices to boost their earnings.
SLV Total Return Level Chart

SLV Total Return Level data by YCharts

And silver miners, broadly speaking, are in fundamentally sturdy positions because margins are high while leverage is declining. Plus, silver supply is constrained, potentially positioning dedicated silver miners to rally if prices of the metal do the same.

Economic clues matter

Investors who are evaluating silver ETFs also need to consider that industry is one of the primary demand drivers for this metal, which is to say, it is an economically sensitive commodity. Some market observers argue that recent weakness in silver prices may be a sign that the broader economy is poised to cool.

It's not a stretch to envision both the iShares and Global X ETFs struggling against the backdrop of a softer economy, but, as noted above, miners don't necessarily need silver prices to surge to generate solid earnings per share. That doesn't mean that if the economy slumps, the Global X fund will be immune, but it could continue outpacing spot prices.

Some banks are forecasting a silver rebound in 2027. If it materializes, both of these ETFs could benefit.

Should you buy stock in Global X Funds - Global X Silver Miners ETF right now?

Before you buy stock in Global X Funds - Global X Silver Miners ETF, consider this:

The Motley Fool Stock Advisor analyst team just identified what they believe are the 10 best stocks for investors to buy now… and Global X Funds - Global X Silver Miners ETF wasn’t one of them. The 10 stocks that made the cut could produce monster returns in the coming years.

Consider when Netflix made this list on December 17, 2004... if you invested $1,000 at the time of our recommendation, you’d have $348,060!* Or when Nvidia made this list on April 15, 2005... if you invested $1,000 at the time of our recommendation, you’d have $1,067,492!*

Now, it’s worth noting Stock Advisor’s total average return is 849% — a market-crushing outperformance compared to 210% for the S&P 500. Don't miss the latest top 10 list, available with Stock Advisor, and join an investing community built by individual investors for individual investors.

See the 10 stocks »

*Stock Advisor returns as of November 12, 2026.

Todd Shriber has no position in any of the stocks mentioned. The Motley Fool has no position in any of the stocks mentioned. The Motley Fool has a disclosure policy.

Disclaimer: For information purposes only. Past performance is not indicative of future results.
placeholder
Gold Price Analysis Today | Forex Gold Analysis | XAU/USD Analysis - November 11, 2026Get the latest gold price analysis, forex gold insights, and XAU/USD analysis for November 11, 2026. Read on for the details.
Author  Mitrade
Nov 11, Wed
Get the latest gold price analysis, forex gold insights, and XAU/USD analysis for November 11, 2026. Read on for the details.
placeholder
Bitcoin lost its 200-day average — but the exit started three sessions before the CPIBitcoin fell 2.5% to about $73,400 on 11 November, an 11-week low, breaking its 200-day moving average near $73,100. The 24-hour liquidation tally reached $632 to $705 million, roughly 82% of it longs. But spot ETF outflows began three sessions earlier and USDT's market cap has shrunk $6.6 billion in 60 days — the leveraged length left before the inflation print did. A double top at 81,890 and 81,080 leaves a measured target of 69,366.
Author  Suzie
Nov 11, Wed
Bitcoin fell 2.5% to about $73,400 on 11 November, an 11-week low, breaking its 200-day moving average near $73,100. The 24-hour liquidation tally reached $632 to $705 million, roughly 82% of it longs. But spot ETF outflows began three sessions earlier and USDT's market cap has shrunk $6.6 billion in 60 days — the leveraged length left before the inflation print did. A double top at 81,890 and 81,080 leaves a measured target of 69,366.
placeholder
Nvidia slid 7.7% after hours while AMD and Broadcom rose — the AI trade changed hands, it didn't breakNvidia closed Wednesday at 173.73, up 2.87%, then fell as much as 8.1% to 159.44 after reports that its board was preparing for a possible leadership change. The same session, the Philadelphia Semiconductor Index rose 5.7% with all 30 components higher, CoreWeave jumped 24.7% on 168% revenue growth, and Micron added 11.9%. If AI demand were being repriced, AMD and Broadcom would not be bid. This is a governance discount on one name, and 204.54 — the 200-day average — is the level that settles it.
Author  Irene Q.
Nov 12, Thu
Nvidia closed Wednesday at 173.73, up 2.87%, then fell as much as 8.1% to 159.44 after reports that its board was preparing for a possible leadership change. The same session, the Philadelphia Semiconductor Index rose 5.7% with all 30 components higher, CoreWeave jumped 24.7% on 168% revenue growth, and Micron added 11.9%. If AI demand were being repriced, AMD and Broadcom would not be bid. This is a governance discount on one name, and 204.54 — the 200-day average — is the level that settles it.
placeholder
Gold hit a one-year low while central banks bought 321 tonnes — the sellers were never the ones you thinkSpot gold closed at 3,876 on Thursday, down 2.8% and its lowest close in more than a year, with an intraday low near 3,852. The dollar is at a 19-month high of 103.21 and the 10-year yield is at 5.10%, so the price move is easy to explain. What is harder to explain is who sold: central banks bought 321 tonnes in Q3, the PBoC added for a 24th straight month, ETF holdings are near a record 4,256 tonnes, and roughly 95% of the futures selling came from non-reportable and sovereign-type accounts rather than hedge funds. This piece separates the two books that have to balance.
Author  Irene Q.
Nov 13, Fri
Spot gold closed at 3,876 on Thursday, down 2.8% and its lowest close in more than a year, with an intraday low near 3,852. The dollar is at a 19-month high of 103.21 and the 10-year yield is at 5.10%, so the price move is easy to explain. What is harder to explain is who sold: central banks bought 321 tonnes in Q3, the PBoC added for a 24th straight month, ETF holdings are near a record 4,256 tonnes, and roughly 95% of the futures selling came from non-reportable and sovereign-type accounts rather than hedge funds. This piece separates the two books that have to balance.
placeholder
Brent rose 3.3% and US crude stocks built 4.66 million barrels in the same weekBrent January settled at 95.82, up 3.3%, and WTI at 88.74, up 2.55%, after the US signalled it would not pursue a deal with Iran and attacks on Gulf shipping continued. In the same week, EIA data showed US crude inventories rising 4.657 million barrels against expectations of a 1.1 million draw, with gasoline up another 1.799 million. OPEC output also rebounded 1.96 million barrels a day to 27.16 million in October, led by Saudi Arabia at 10.56 million. This piece separates the geopolitical premium from the physical balance and lays out where each side of the trade is anchored.
Author  Irene Q.
Nov 13, Fri
Brent January settled at 95.82, up 3.3%, and WTI at 88.74, up 2.55%, after the US signalled it would not pursue a deal with Iran and attacks on Gulf shipping continued. In the same week, EIA data showed US crude inventories rising 4.657 million barrels against expectations of a 1.1 million draw, with gasoline up another 1.799 million. OPEC output also rebounded 1.96 million barrels a day to 27.16 million in October, led by Saudi Arabia at 10.56 million. This piece separates the geopolitical premium from the physical balance and lays out where each side of the trade is anchored.
goTop
quote