

TSMC Stock Price Forecast: October Revenue Surges Nearly 60%, May Support Stock's Return to $400

Source Tradingkey

TradingKey - As of Monday's close (November 9) Eastern Time, TSMC (TSM) ADR rose 3.51% to $388.62, reaching an intraday high of $394.39 on a trading volume of approximately 15.65 million shares, and edged up further to around $393 in after-hours trading. Previously, TSM plunged 10.78% in a single day on November 5, touching a low of $351.19, before rebounding for two consecutive trading sessions, now having recovered more than 10% from its recent low.

From a fundamental perspective, TSMC released its latest monthly revenue report on November 10, showing consolidated revenue of approximately NT$586.89 billion for October, up 14.7% month-over-month and surging 59.7% year-over-year. Cumulative revenue from January through October reached NT$4.486 trillion, representing a year-over-year increase of 43.3%. This growth rate was notably higher than the company's overall revenue growth pace year-to-date, indicating that demand for advanced manufacturing processes and AI-related chips continues to provide strong support for revenue.

Previously, TSMC had posted record profits for a sixth consecutive quarter in the third quarter, while maintaining a relatively prudent outlook for 2027. Therefore, beyond monthly revenue growth, investors still need to keep a close eye on AI demand, advanced process capacity, and changes in capital expenditures.
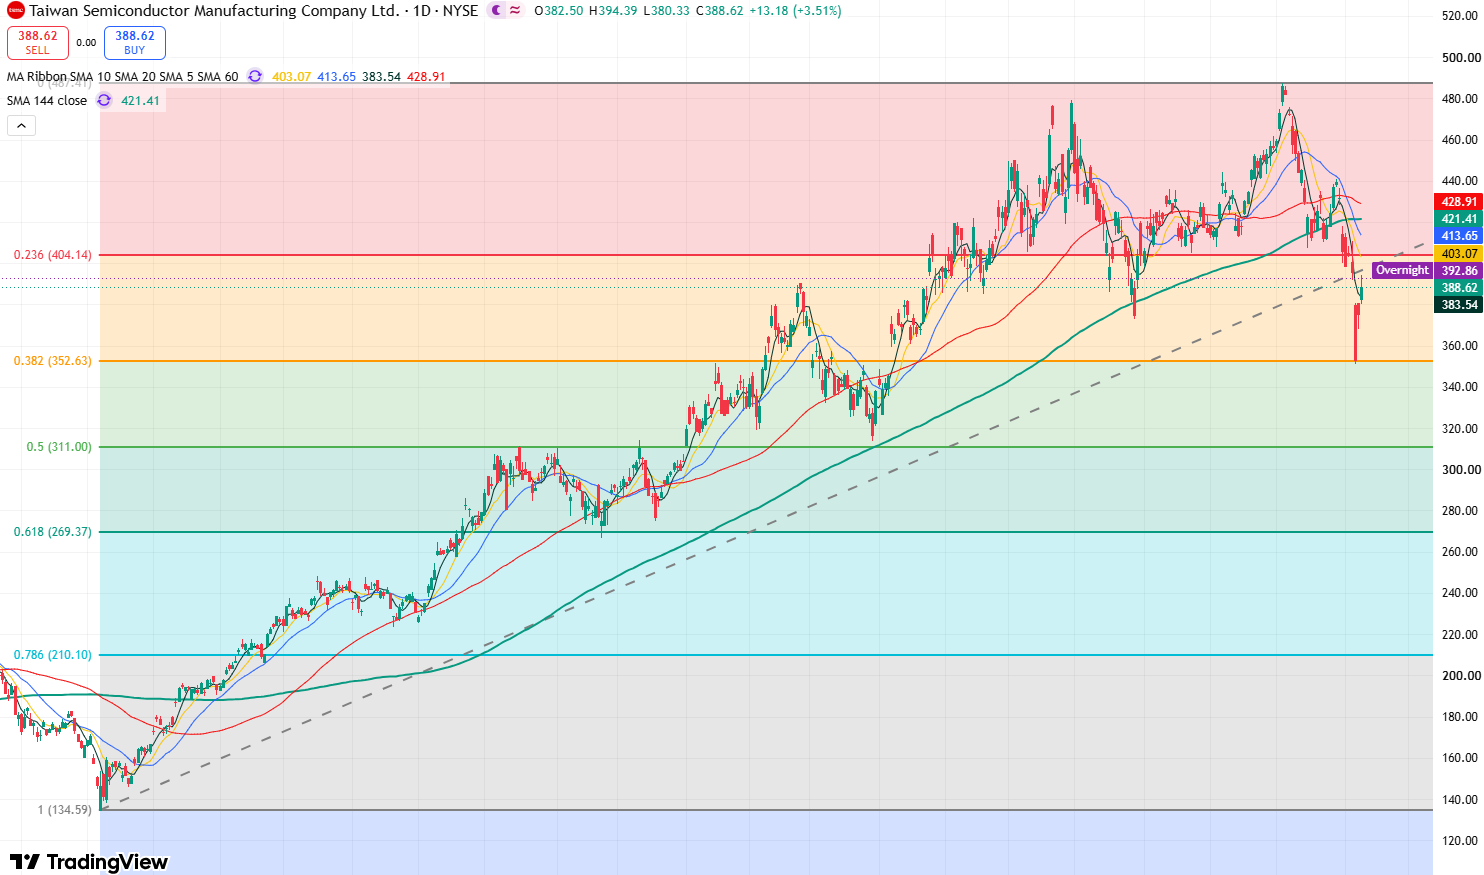
tsm-91b616f5605f4b4282f47f37a5b077ca

TSM daily stock chart, Source: TradingView

Looking at TSM's daily stock chart, following a continuous correction since late October, the stock fell to a low of $351.19 on November 5, near the Fibonacci 0.382 retracement level, which provided some support. It subsequently rose 6.33% on November 6 and gained another 3.51% to $388.62 on November 9. Following two consecutive sessions of rebound, the short-term price structure has shown clear signs of repair, and the stock may extend its rebound in the near term, with the primary target testing the $400-$410 resistance zone.

At present, although the stock has rebounded for two trading sessions, it remains capped by the 10-day and 20-day moving averages. Therefore, the current move is still a rebound phase following the prior sharp pullback, and the medium-term trend has not yet fully recovered.

On the upside, the primary overhead resistance to watch is $400-$410. Only when the stock breaks out decisively and holds above $410 will greater upside potential open up, paving the way for a further test of the resistance near $440. If that level is breached, the stock will once again challenge the $500 mark.

On the downside, the primary support level to watch is $380. If this level fails to hold, the stock will test the $368-$370 range. Continued declines could see the stock fall further toward the key support near $350.

Disclaimer: For information purposes only. Past performance is not indicative of future results.
placeholder
Ethereum Drops Below $2,000 After Plunging Over 20% in a Month as Odds of $1,500 Retest SurgeEthereum Plunges Over 20% in a Month, Risking a Retest of $1,500 After Losing the $2,000 Defense Line.On November 13, Ethereum (ETH) plunged more than 5%, officially falling below the key
Author  TradingKey
12 hours ago
Ethereum Plunges Over 20% in a Month, Risking a Retest of $1,500 After Losing the $2,000 Defense Line.On November 13, Ethereum (ETH) plunged more than 5%, officially falling below the key
placeholder
Gold Price Forecast: Gold Tumbles Below $3,900 as Trump Says No Need for Iran Deal; Can October PPI Spur a Rebound? As of the Asian session on Friday (November 13), gold prices (XAUUSD) rebounded intraday following Thursday's sharp decline, trading near $3,910. Previously, gold tumbled 2.76% on Thursda
Author  TradingKey
14 hours ago
As of the Asian session on Friday (November 13), gold prices (XAUUSD) rebounded intraday following Thursday's sharp decline, trading near $3,910. Previously, gold tumbled 2.76% on Thursda
placeholder
Brent rose 3.3% and US crude stocks built 4.66 million barrels in the same weekBrent January settled at 95.82, up 3.3%, and WTI at 88.74, up 2.55%, after the US signalled it would not pursue a deal with Iran and attacks on Gulf shipping continued. In the same week, EIA data showed US crude inventories rising 4.657 million barrels against expectations of a 1.1 million draw, with gasoline up another 1.799 million. OPEC output also rebounded 1.96 million barrels a day to 27.16 million in October, led by Saudi Arabia at 10.56 million. This piece separates the geopolitical premium from the physical balance and lays out where each side of the trade is anchored.
Author  Irene Q.
18 hours ago
Brent January settled at 95.82, up 3.3%, and WTI at 88.74, up 2.55%, after the US signalled it would not pursue a deal with Iran and attacks on Gulf shipping continued. In the same week, EIA data showed US crude inventories rising 4.657 million barrels against expectations of a 1.1 million draw, with gasoline up another 1.799 million. OPEC output also rebounded 1.96 million barrels a day to 27.16 million in October, led by Saudi Arabia at 10.56 million. This piece separates the geopolitical premium from the physical balance and lays out where each side of the trade is anchored.
placeholder
Gold hit a one-year low while central banks bought 321 tonnes — the sellers were never the ones you thinkSpot gold closed at 3,876 on Thursday, down 2.8% and its lowest close in more than a year, with an intraday low near 3,852. The dollar is at a 19-month high of 103.21 and the 10-year yield is at 5.10%, so the price move is easy to explain. What is harder to explain is who sold: central banks bought 321 tonnes in Q3, the PBoC added for a 24th straight month, ETF holdings are near a record 4,256 tonnes, and roughly 95% of the futures selling came from non-reportable and sovereign-type accounts rather than hedge funds. This piece separates the two books that have to balance.
Author  Irene Q.
18 hours ago
Spot gold closed at 3,876 on Thursday, down 2.8% and its lowest close in more than a year, with an intraday low near 3,852. The dollar is at a 19-month high of 103.21 and the 10-year yield is at 5.10%, so the price move is easy to explain. What is harder to explain is who sold: central banks bought 321 tonnes in Q3, the PBoC added for a 24th straight month, ETF holdings are near a record 4,256 tonnes, and roughly 95% of the futures selling came from non-reportable and sovereign-type accounts rather than hedge funds. This piece separates the two books that have to balance.
placeholder
Today’s Market Recap: Nvidia Drops Over 4% After Jensen Huang Resigns, AMD and Broadcom Both Rise Over 5% On November 12, the three major U.S. stock indices closed slightly lower. Nvidia announced that Jensen Huang had stepped down immediately as CEO and director, draggi
Author  TradingKey
19 hours ago
On November 12, the three major U.S. stock indices closed slightly lower. Nvidia announced that Jensen Huang had stepped down immediately as CEO and director, draggi
goTop
quote