


$10,000 Invested in Robinhood at Its IPO Would Be Worth About $27,160 Today
Key Points
Robinhood stock has pulled back substantially from its peak, but it's still up big since its IPO.
The stock trades at a growth-dependent valuation, but the company has a strong platform and net income margin profile.
- 10 stocks we like better than Robinhood Markets ›
Robinhood (NASDAQ: HOOD) has transformed the world of trading for retail investors. The company's easily accessible, streamlined application for buying and selling stocks and cryptocurrencies has become hugely popular with traders, and strong growth has translated into impressive performance for shareholders.
Robinhood conducted its initial public offering (IPO) on July 29, 2021, and its stock actually fell significantly in its first day of trading. However, buyers who held on to their early investments were rewarded for their patience.
Missed Nvidia in 2009? This Rare Signal Is Flashing Again. In 2009, a "Double Down" signal flashed for a little-known chipmaker called Nvidia. For the first time in years, that same "Total Conviction" signal is flashing for a company 1/100th the size of Nvidia. Continue »

Image source: Getty Images.
Robinhood stock has been a long-term winner despite volatility
Robinhood opened trading on the market at roughly $38 per share on the day of its initial public offering, but it wound up closing its first daily session priced at $34.82. While the company's IPO didn't represent a strong start for the stock, its share price rebounded before too long and went on to notch new highs.
The company's share price hit an all-time peak of $152.46 in October 2025, powered in part by record valuations for leading cryptocurrencies. In conjunction with pullbacks for the crypto market, Robinhood stock is down roughly 38% from its valuation peak -- but it has still delivered huge returns for investors who bought at its IPO and held. If you invested $10,000 in Robinhood stock at its closing price on the day of its public debut, your holdings would now be worth roughly $27,160.
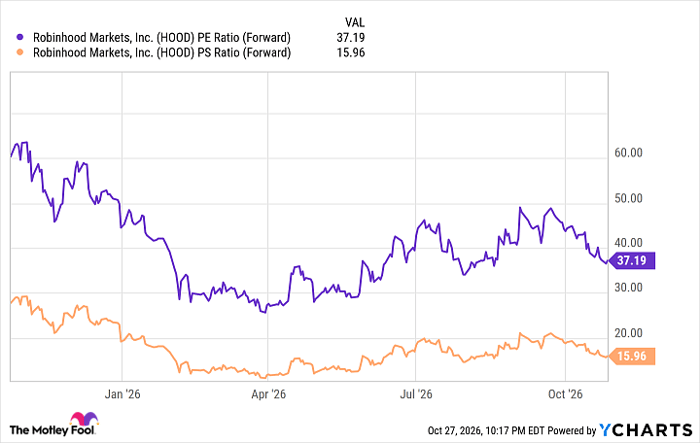
HOOD PE Ratio (Forward) data by YCharts. PE = price-to-earnings. PS = price-to-sales.
Robinhood now trades at roughly 37 times this year's expected earnings and 16 times expected sales. While the company trades at a growth-dependent valuation, its strong net income margin profile and solid sales momentum suggest that the stock could still offer significant upside over the long term.
In the company's recently published third-quarter report, sales rose roughly 12% year over year to reach $1.42 billion. On the other hand, adjusted earnings per share declined 3% year over year to $0.60. The decline in earnings per share was primarily driven by higher operating expenses, which increased 16% year over year. The company actually set its new full-year operating expenses target at between $2.675 billion and $2.75 billion -- lowering the top end of its target by $25 million.
Operational efficiency improvements and stock buybacks could support stronger earnings in combination with continued sales growth. The prediction market category is emerging as a powerful growth driver, and the company is introducing new products at an encouraging clip. Along with stronger sales and earnings momentum, valuation rebounds for the cryptocurrency market could also help push Robinhood's valuation higher.
Should you buy stock in Robinhood Markets right now?
Before you buy stock in Robinhood Markets, consider this:
The Motley Fool Stock Advisor analyst team just identified what they believe are the 10 best stocks for investors to buy now… and Robinhood Markets wasn’t one of them. The 10 stocks that made the cut could produce monster returns in the coming years.
Consider when Netflix made this list on December 17, 2004... if you invested $1,000 at the time of our recommendation, you’d have $334,631!* Or when Nvidia made this list on April 15, 2005... if you invested $1,000 at the time of our recommendation, you’d have $1,312,844!*
Now, it’s worth noting Stock Advisor’s total average return is 893% — a market-crushing outperformance compared to 213% for the S&P 500. Don't miss the latest top 10 list, available with Stock Advisor, and join an investing community built by individual investors for individual investors.
See the 10 stocks »
*Stock Advisor returns as of October 31, 2026.
Keith Noonan has no position in any of the stocks mentioned. The Motley Fool recommends Robinhood Markets. The Motley Fool has a disclosure policy.
Recommended Articles


