

Storage Stocks Plunge Again Pre-Market; Micron Drops Over 4%, SanDisk Down Over 3%, Western Digital Falls Over 5%

Source Tradingkey

TradingKey - Pre-market on October 30 ET, U.S. memory chip stocks continued their downward trend from the previous trading session. Although SanDisk's latest quarterly results beat market expectations, overall weakness in tech stocks and market concerns over returns on AI infrastructure investments continued to weigh on memory-related shares.

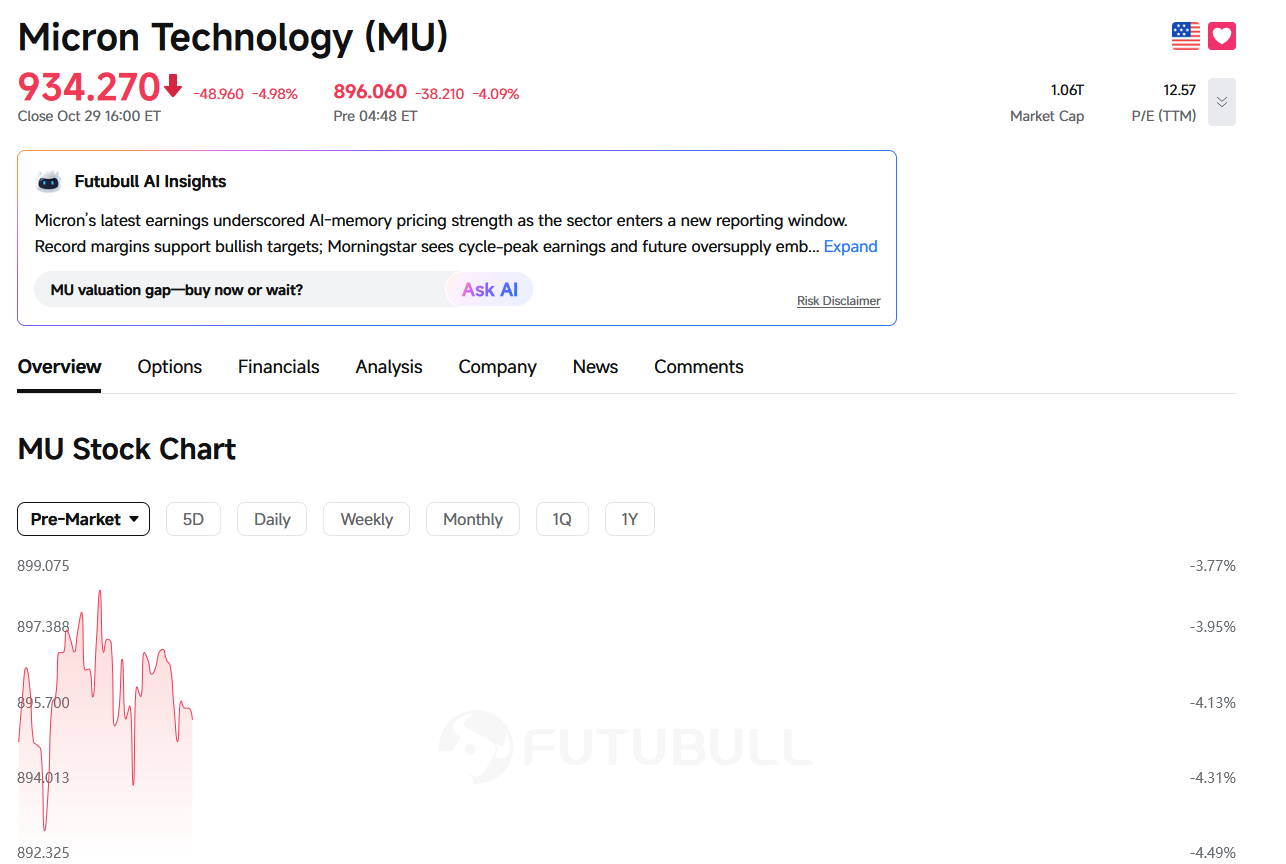
As of press time, Micron Technology (MU) was down about 4.0% in pre-market trading, at $895; Western Digital (WDC) fell about 5.5% to $373.76. Other memory stocks also weakened in Thursday post-market trading, with SanDisk (SNDK) falling about 3.8% after hours, Seagate Technology (STX) dropping about 5.3%, and SK Hynix's U.S. ADR (SKHY) falling about 6.6%.
mu-ad49c604e6cf4faeb396d502a09faefd

Micron's pre-market stock price movement. Source: FUTUBULL

Earlier, the memory sector had already experienced a noticeable pullback on Thursday. Among them, Micron Technology closed down 4.98%, SanDisk fell 5.32%, SK Hynix ADRs slipped 1.58%, Western Digital edged down 0.25%, while Seagate Technology rose 0.36%.

Notably, SanDisk reported its Q1 FY2027 results after Thursday's market close, with revenue reaching $11.031 billion, a 378% year-over-year increase, beating the market expectation of approximately $10.72 billion. Adjusted earnings per share came in at $49.51, also topping the expected $46.67. The company expects Q2 revenue to reach $12.2 billion to $12.6 billion and announced an 8-for-1 stock split. However, the strong financial results failed to reverse its post-market stock decline.

Meanwhile, South Korean memory giants continued to face pressure on Friday. By the close of the South Korean stock market, SK Hynix shares fell 7.08%, and Samsung Electronics fell 3.02%. Previously, Samsung reported net profit below market expectations, which, combined with the widespread decline in overnight U.S. tech stocks, further impacted the short-term performance of the memory sector.

Disclaimer: For information purposes only. Past performance is not indicative of future results.
placeholder
Anthropic files for a $2 trillion IPO — the $80.7 billion loss is the decoy, the $450 billion compute bill is the riskAnthropic publicly filed its S-1 on October 26, revealing $16.29 billion of first-half revenue (+1,304% year over year) and a $80.7 billion net loss — of which $72.4 billion is a non-cash convertible-note charge. The real number is the $450 billion of signed, mostly non-cancelable compute commitments. Here is what the filing says, why NVDA, ARM and MU are the tradeable read-through, and the conditions that decide whether the AI trade passes its first public valuation test.
Author  Irene Q.
Oct 27, Tue
Anthropic publicly filed its S-1 on October 26, revealing $16.29 billion of first-half revenue (+1,304% year over year) and a $80.7 billion net loss — of which $72.4 billion is a non-cash convertible-note charge. The real number is the $450 billion of signed, mostly non-cancelable compute commitments. Here is what the filing says, why NVDA, ARM and MU are the tradeable read-through, and the conditions that decide whether the AI trade passes its first public valuation test.
placeholder
Brent's $115 front month sits $4.6 above January — the $14 spread to WTI is the supply-risk premiumDecember Brent trades at $115.29 while January is $110.71, a $4.58 backwardation. The December Brent-WTI spread is $14.2, versus a $3-5 normal. That gap, not the headline, is where the Middle East supply risk is priced. Here is what the curve says, why the December contract's expiry on October 30 will mechanically cut the headline by $4.6, and the 108.81 neckline that decides the next move.
Author  Irene Q.
Oct 28, Wed
December Brent trades at $115.29 while January is $110.71, a $4.58 backwardation. The December Brent-WTI spread is $14.2, versus a $3-5 normal. That gap, not the headline, is where the Middle East supply risk is priced. Here is what the curve says, why the December contract's expiry on October 30 will mechanically cut the headline by $4.6, and the 108.81 neckline that decides the next move.
placeholder
Gold Price Analysis Today | Forex Gold Analysis | XAU/USD Analysis - October 29, 2026Get the latest gold price analysis, forex gold insights, and XAU/USD analysis for October 29, 2026. Read on for the details.
Author  Mitrade
Oct 29, Thu
Get the latest gold price analysis, forex gold insights, and XAU/USD analysis for October 29, 2026. Read on for the details.
placeholder
Gold Price Analysis Today | Forex Gold Analysis | XAU/USD Analysis - October 30, 2026Get the latest gold price analysis, forex gold insights, and XAU/USD analysis for October 30, 2026. Read on for the details.
Author  Mitrade
Oct 30, Fri
Get the latest gold price analysis, forex gold insights, and XAU/USD analysis for October 30, 2026. Read on for the details.
placeholder
US GDP grew 3.4% and core PCE held at 3.1% — December is now a hike trade, not a cut tradeUS Q3 GDP rose 3.4%, above the 3.1% estimate, while September headline PCE hit 3.6% and core held at 3.1%. December hike odds are near 90%; inventories, AI capex and energy explain why.
Author  Irene Q.
Oct 30, Fri
US Q3 GDP rose 3.4%, above the 3.1% estimate, while September headline PCE hit 3.6% and core held at 3.1%. December hike odds are near 90%; inventories, AI capex and energy explain why.
goTop
quote