


Google Drops 13% in Worst Post-Earnings Performance Ever, but History Shows 84.6% Win Rate Buying After 8% Drop
TradingKey - Shares of Google (GOOGL)(GOOG) tumbled more than 13% in early trading following its third-quarter earnings report, marking the company's worst post-earnings stock performance on record. Lower-than-expected Search revenue and a sharp increase in planned capital expenditures for next year led investors to reevaluate the balance between AI spending and earnings returns.
JPMorgan lowered its price target on Alphabet from $425 to $375, while Goldman Sachs cut its 12-month price target from $435 to $385, a reduction of about 11.5%, while maintaining a "Buy" rating. Based on the October 28 closing price of $324.89, Goldman Sachs' new price target implies an upside potential of approximately 18.5%.
Alphabet's third-quarter Search & other revenue came in at $63.35 billion, missing Goldman Sachs' forecast of $64.2 billion and falling about 2.4% short of the consensus estimate of $64.895 billion. With Search being a crucial revenue driver for the company, its weaker-than-expected performance has intensified market focus on whether core business growth can support expanding AI investments. Meanwhile, the company maintained its 2026 capital expenditure guidance of $195 billion to $205 billion and signaled a further substantial increase in spending for 2027.
As of press time, Google shares remained down 11.6% at $284.33.
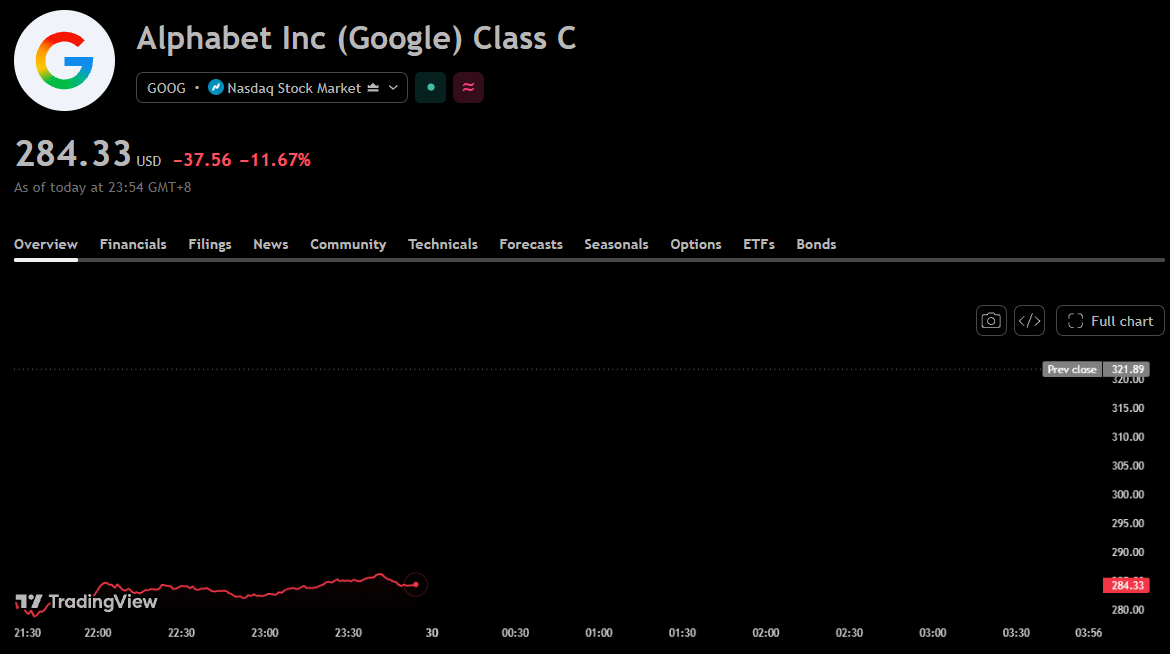
Google stock chart, Source: TradingView
However, Goldman Sachs analyst Eric Sheridan and his team remain bullish on Alphabet's long-term positioning in consumer and enterprise AI computing. Their rationale relies on an app ecosystem reaching over one billion users, alongside capabilities forged by large-scale computing investments: as AI commercialization moves from infrastructure to platforms and applications, Google has the opportunity to reach users and expand revenue through its existing products.
In addition, despite Google recording its worst post-earnings stock performance in history this time, post-plunge price trends offer another reference point. As of October 28, 2026, GOOGL has experienced 13 single-day closing drops of over 8% in its history. Buying at the closing price on those days and holding for 60 trading days yielded positive returns 11 times, translating to a historical win rate of 84.6%.
Historical Plunge Date | Daily Closing Change | 20-Trading-Day Return | 60-Trading-Day Return |
November 5, 2004 | -8.31% | 4.10% | 21.60% |
January 20, 2006 | -8.48% | -7.70% | 1.20% |
February 1, 2008 | -8.58% | -11.40% | 8.30% |
July 18, 2008 | -9.77% | 6.00% | -20.80% |
September 29, 2008 | -11.61% | -13.50% | -21.80% |
December 1, 2008 | -9.21% | 14.00% | 27.10% |
April 15, 2011 | -8.26% | -2.30% | 1.40% |
January 20, 2012 | -8.38% | 3.20% | 4.00% |
October 18, 2012 | -8.01% | -3.90% | 2.30% |
March 12, 2020 | -8.20% | 8.50% | 30.30% |
March 16, 2020 | -11.63% | 17.90% | 36.50% |
October 26, 2022 | -9.14% | 3.70% | 2.90% |
October 25, 2023 | -9.51% | 10.30% | 17.10% |
It should be noted that this sample includes sharp declines triggered by earnings as well as other factors, rather than focusing exclusively on post-earnings moves; furthermore, two losses exceeded 20%, indicating that a high win rate is still accompanied by significant risk.
Recommended Articles


