

Microsoft Stock Price Forecast: Stock Nears $550 After Earnings Beat, Next Target Expected to Reach $600

Source Tradingkey

TradingKey - On October 29, Microsoft (MSFT) saw its stock price move significantly higher in after-hours trading following the release of its earnings report. Microsoft shares closed at $531.01 on October 28, down slightly by 0.06%, but surged over 3% in after-hours trading after the earnings release, briefly approaching $550, just shy of its all-time high of $555.45.

Why Is Microsoft Stock Rising?

According to the latest financial report, for the first quarter of fiscal year 2027 ended September 30, 2026, Microsoft reported revenue of $92.28 billion, up 19% year-over-year and beating market expectations of around $90.6 billion; operating income reached $45.9 billion, a year-over-year increase of 21%. GAAP net income was $36.6 billion, up 32% year-over-year, with diluted earnings per share of $4.92. Excluding the impact of the OpenAI investment, adjusted EPS was $4.89, also topping market expectations of approximately $4.73.

In terms of cloud computing, it remained the primary driver of growth this quarter. Microsoft Cloud revenue reached $63.9 billion, up 30% year-over-year; Azure revenue rose 48% year-over-year to $33.17 billion, exceeding both market expectations of $32.84 billion and the company's prior growth guidance. Microsoft's commercial remaining performance obligation (RPO) surged 73% year-over-year to $677 billion, indicating that the volume of signed enterprise customer contracts not yet recognized as revenue continues to expand.

Regarding cash flow, capital expenditures in the first fiscal quarter reached $45.2 billion, up from $34.9 billion in the same period last year, but below the company's prior expectation of around $50 billion. Microsoft stated that this was mainly related to delays in the delivery of some third-party computing capacity and does not mean the company is scaling back its AI infrastructure investment plans. Meanwhile, the company's free cash flow for the quarter reached $18.6 billion, significantly higher than market expectations of about $8.5 billion.

The financial report indicates that Microsoft remains in a high capital expenditure phase, but Azure revenue growth and cash flow have not shown significant signs of deterioration for now. Particularly as investors have recently focused more on the return on AI investments for Big Tech, Microsoft's Azure and free cash flow figures for this quarter provided key support for the stock's post-earnings rise.

Meanwhile, next-quarter guidance further supported the stock's rally. Microsoft expects second-quarter Azure revenue to grow 49% to 50% year-over-year, higher than market expectations of around 47.6%; the company projects total quarterly revenue of $96.0 billion to $97.1 billion, also above market forecasts of approximately $95.6 billion.

Microsoft Stock Price Technical Analysis
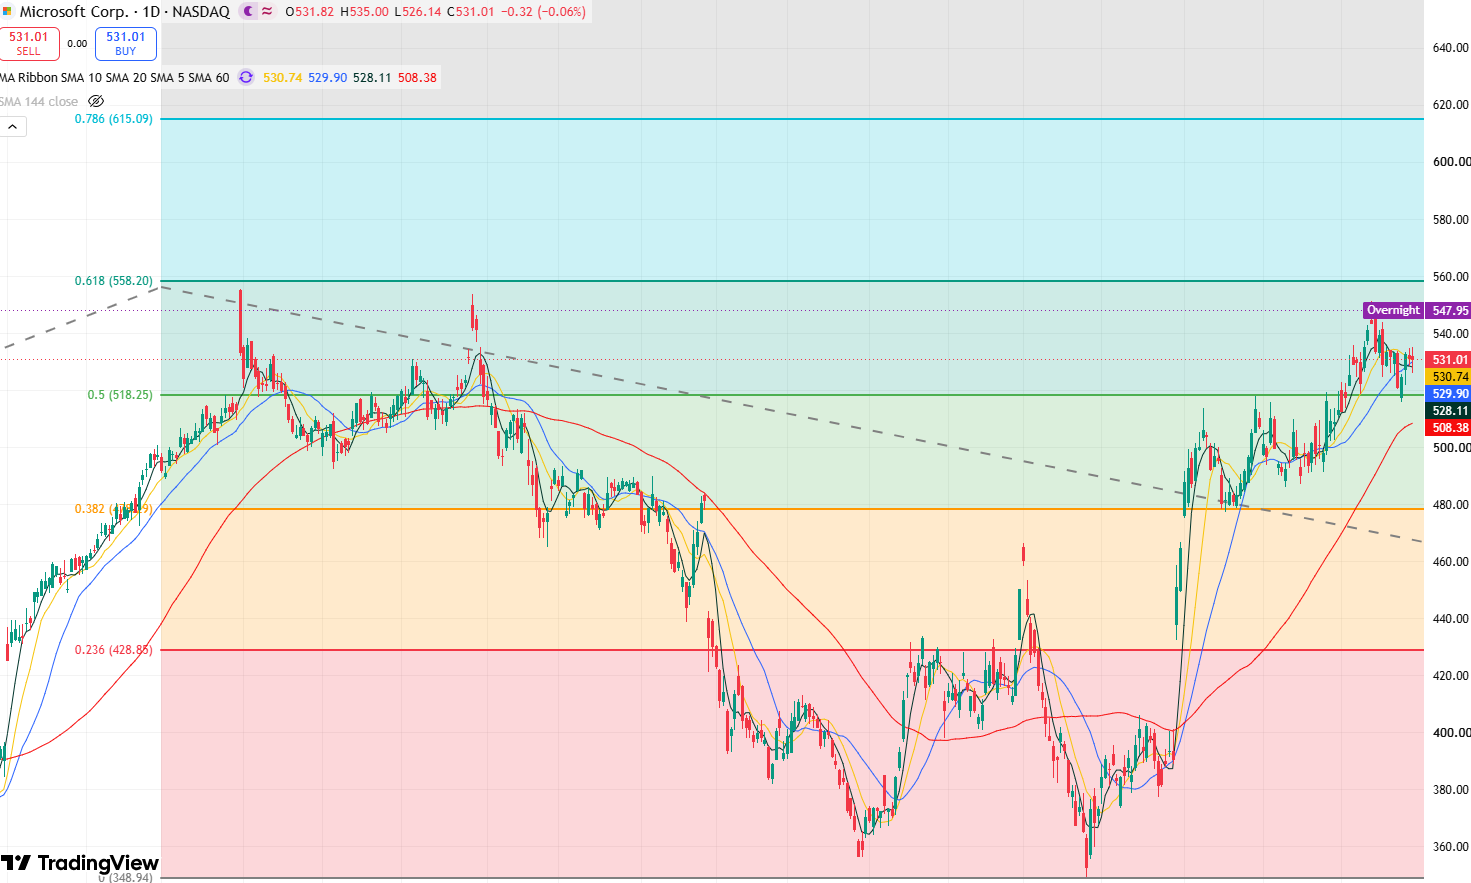
msft-202e56ea625c49e3960afcc8a9ffc3ef

Microsoft stock price daily chart, Source: TradingView

Looking at the daily chart of Microsoft's stock price, the trend over the past four months shows a clear and strong upward trajectory. Although the stock recently pulled back after testing the $550 resistance level, it rebounded after retreating to support near $518. Boosted by positive earnings, the stock touched near $550 again, significantly strengthening short-term bullish momentum.

Currently, if the stock price can sustain yesterday's after-hours trend at today's open, it will continue to test $550-$555.45 to the upside. If the stock can effectively break through and hold above its previous all-time high of $555.45, it will further open up upside potential toward $600-$615.

Conversely, if the stock continues to face pressure below $550-$555.45, it may continue to pull back downward. The primary downside support to monitor is near $518. If it continues downward, the stock may test support at the 60-day moving average near $500. If this level fails to hold, the stock could fall further toward the support level around $480.

Disclaimer: For information purposes only. Past performance is not indicative of future results.
placeholder
The Fed will sit still on October 28 — but 100 of 100 economists now expect a December hikeA Reuters poll run October 16-20 found 94 of 100 economists expecting the Fed to hold at 3.75-4.00% on October 28 — and all 100 expecting a hike in December, against less than half a month earlier. The market is close to the same price, with CME FedWatch at roughly 17% for October and 82.8% for December. With the Fed in blackout since October 17, here are the five dates that decide the rest of the year, what each one is priced for, and the two directions each can take.
Author  Irene Q.
Oct 22, Thu
A Reuters poll run October 16-20 found 94 of 100 economists expecting the Fed to hold at 3.75-4.00% on October 28 — and all 100 expecting a hike in December, against less than half a month earlier. The market is close to the same price, with CME FedWatch at roughly 17% for October and 82.8% for December. With the Fed in blackout since October 17, here are the five dates that decide the rest of the year, what each one is priced for, and the two directions each can take.
placeholder
Big Tech's $800 billion AI bill faces its first real test — free cash flow is the judgeAlphabet and Microsoft report after the close on October 28, Amazon on October 29, with hyperscaler AI capex running near $800 billion a year. Meta's negative free cash flow and 9.40% drop on October 22 was the warning; this week's prints decide whether cloud growth and backlog can pay for the buildout. Here are the consensus numbers, the free-cash-flow table and the two-sided test.
Author  Irene Q.
Oct 26, Mon
Alphabet and Microsoft report after the close on October 28, Amazon on October 29, with hyperscaler AI capex running near $800 billion a year. Meta's negative free cash flow and 9.40% drop on October 22 was the warning; this week's prints decide whether cloud growth and backlog can pay for the buildout. Here are the consensus numbers, the free-cash-flow table and the two-sided test.
placeholder
Anthropic files for a $2 trillion IPO — the $80.7 billion loss is the decoy, the $450 billion compute bill is the riskAnthropic publicly filed its S-1 on October 26, revealing $16.29 billion of first-half revenue (+1,304% year over year) and a $80.7 billion net loss — of which $72.4 billion is a non-cash convertible-note charge. The real number is the $450 billion of signed, mostly non-cancelable compute commitments. Here is what the filing says, why NVDA, ARM and MU are the tradeable read-through, and the conditions that decide whether the AI trade passes its first public valuation test.
Author  Irene Q.
Oct 27, Tue
Anthropic publicly filed its S-1 on October 26, revealing $16.29 billion of first-half revenue (+1,304% year over year) and a $80.7 billion net loss — of which $72.4 billion is a non-cash convertible-note charge. The real number is the $450 billion of signed, mostly non-cancelable compute commitments. Here is what the filing says, why NVDA, ARM and MU are the tradeable read-through, and the conditions that decide whether the AI trade passes its first public valuation test.
placeholder
Fed October Rate Decision Preview: Rate Hike Pause Has Become Consensus, How Will US Stocks, Dollar, and Gold React?The Federal Reserve will announce its October interest rate decision at 14:00 Eastern Time on October 28, and Fed Chair Warsh will hold a press conference at 14:30. Markets currently wide
Author  TradingKey
Oct 27, Tue
The Federal Reserve will announce its October interest rate decision at 14:00 Eastern Time on October 28, and Fed Chair Warsh will hold a press conference at 14:30. Markets currently wide
placeholder
Brent's $115 front month sits $4.6 above January — the $14 spread to WTI is the supply-risk premiumDecember Brent trades at $115.29 while January is $110.71, a $4.58 backwardation. The December Brent-WTI spread is $14.2, versus a $3-5 normal. That gap, not the headline, is where the Middle East supply risk is priced. Here is what the curve says, why the December contract's expiry on October 30 will mechanically cut the headline by $4.6, and the 108.81 neckline that decides the next move.
Author  Irene Q.
21 hours ago
December Brent trades at $115.29 while January is $110.71, a $4.58 backwardation. The December Brent-WTI spread is $14.2, versus a $3-5 normal. That gap, not the headline, is where the Middle East supply risk is priced. Here is what the curve says, why the December contract's expiry on October 30 will mechanically cut the headline by $4.6, and the 108.81 neckline that decides the next move.
goTop
quote