


Warren Buffett's Favorite Market Gauge Just Hit Its Highest Level Since the 1999 Dot-Com Peak. History Says Investors Should Watch Valuations Closely.
Key Points
Warren Buffett's favorite valuation measure is at an all-time high and keeps climbing.
But this is a valuation metric, not a buy/sell signal.
This measure suggests the current market is above average, but doesn't indicate an imminent correction.
- 10 stocks we like better than Vanguard S&P 500 ETF ›
Warren Buffett has spent decades telling everyday investors that their best bet is to put their money in the S&P 500 (SNPINDEX: ^GSPC) and simply give it time to grow. Don't spend hours and hours researching stocks with the hope of outperforming the market. Just buy the American economy and let long-term compounding growth do the rest.
But one of Buffett's favorite valuation measures is flashing a warning right now.
Missed AI’s "Act 1"? Act 2 Could Be 15x Bigger. Most investors think they missed the AI boat because they didn't buy Nvidia in 2005. But according to our analysts, we’re only at the end of "Act 1"—the R&D phase. "Act 2" is the global rollout. Continue »
The Buffett indicator, which measures the total value of the U.S. stock market relative to the U.S. gross domestic product (GDP), recently hit 244%, its highest level ever, and well above the tech bubble peak of around 150%. In other words, investors are paying record-high prices for each unit of U.S. economic growth.
Buffett has said that investors are "playing with fire" whenever this indicator approaches 200%. Does this mean investors should be exiting the S&P 500 right now?
Not necessarily.
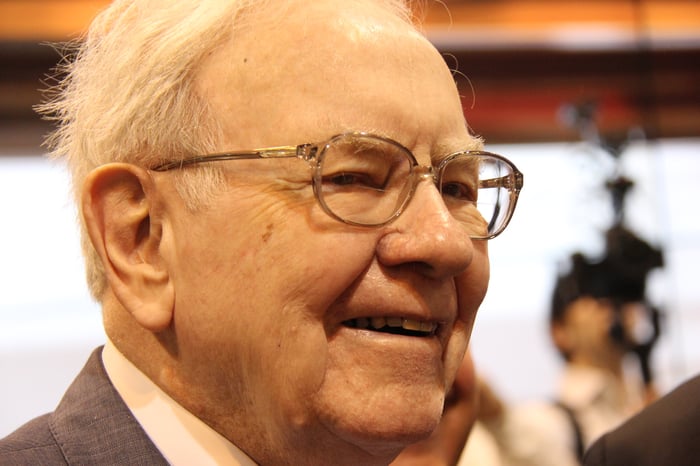
Warren Buffett. Image source: The Motley Fool.
Expensive stocks can become even more expensive
The Buffett indicator makes intuitive sense. Stock prices ultimately need to be supported by corporate earnings and a growing economy.
But it's important to recognize that it's a valuation measure. It's not a buy/sell signal.
Let's imagine a scenario in which you took Buffett's "playing with fire" comment to heart and decided to sell your stake in the Vanguard S&P 500 ETF (NYSEMKT: VOO) when the Buffett indicator first hit 200%. That means you would have sold sometime in late 2021, near the end of the COVID-19 recovery.
You would have avoided the 2022 bear market, which is good. But you also would have completely missed out on the artificial intelligence (AI) bull market that began in 2023. You would have missed a gain of more than 100% over that time frame.
High valuations don't guarantee an imminent decline in stock prices. They can remain expensive for years and become even more expensive before normalizing.
That's why today's Buffett indicator should be viewed more as a measure of risk than a prediction.
Investors are still paying a lot for future growth
The Buffett indicator is one measure of valuation. The forward price/earnings (P/E) multiple on the Vanguard S&P 500 ETF is around 20 right now. That's higher than its long-term average, but not that unreasonable given anticipated earnings growth from the AI boom. This alone suggests that maybe stocks aren't quite as expensive as the Buffett indicator would say.
But the risk is there. Any indication of slowing growth, high inflation, higher interest rates, or disappointing corporate earnings could result in a sharper decline in stock prices, given current valuation levels.
I believe it still makes sense to own stocks, especially if you have several years or decades to go before retirement. But investors might want to temper their expectations for future stock market returns.
Should you buy stock in Vanguard S&P 500 ETF right now?
Before you buy stock in Vanguard S&P 500 ETF, consider this:
The Motley Fool Stock Advisor analyst team just identified what they believe are the 10 best stocks for investors to buy now… and Vanguard S&P 500 ETF wasn’t one of them. The 10 stocks that made the cut could produce monster returns in the coming years.
Consider when Netflix made this list on December 17, 2004... if you invested $1,000 at the time of our recommendation, you’d have $417,413!* Or when Nvidia made this list on April 15, 2005... if you invested $1,000 at the time of our recommendation, you’d have $1,341,294!*
Now, it’s worth noting Stock Advisor’s total average return is 950% — a market-crushing outperformance compared to 212% for the S&P 500. Don't miss the latest top 10 list, available with Stock Advisor, and join an investing community built by individual investors for individual investors.
See the 10 stocks »
*Stock Advisor returns as of September 15, 2026.
David Dierking has no position in any of the stocks mentioned. The Motley Fool has positions in and recommends Vanguard S&P 500 ETF. The Motley Fool has a disclosure policy.
Recommended Articles


