


If a Stock Market Crash Is Coming, History Says This 1 Move Protects Investors Every Single Time
Key Points
The market is facing multiple headwinds right now, which could result in a slump.
Regardless of what the short term holds, a bear market is coming eventually.
History says strong stocks and a long-term outlook can protect against even a severe downturn.
- 10 stocks we like better than S&P 500 Index ›
The stock market is in a tricky place right now, and investors would be wise to start preparing for volatility.
Despite major market indexes like the S&P 500 (SNPINDEX: ^GSPC), Dow Jones Industrial Average (DJINDICES: ^DJI), and Nasdaq Composite (NASDAQINDEX: ^IXIC) reaching all-time highs earlier this year, there's no shortage of headwinds facing the market. Oil prices climbed to more than $100 per barrel, tariff battles are wreaking havoc yet again, and it's becoming more likely the Federal Reserve will hike interest rates this month.
Missed Nvidia in 2009? This Rare Signal Is Flashing Again. In 2009, a "Double Down" signal flashed for a little-known chipmaker called Nvidia. For the first time in years, that same "Total Conviction" signal is flashing for a company 1/100th the size of Nvidia. Continue »
Although stocks have been incredibly resilient through all of this turbulence so far, a bear market is inevitable at some point. Fortunately, decades worth of history prove that just one move can protect your investments.

Image source: Getty Images.
What to do if the stock market crashes in 2026
When the market is tumbling, it can be tempting to either sell your stocks or stop investing altogether. The risk in that, though, is that while it's certain a bear market will begin eventually, nobody knows when that might be.
Say, for instance, you had gotten out of the market in March. The war in Iran had just begun, and many investors worried that soaring oil prices would crash the broader market. Since March 1, however, the S&P 500 has climbed by more than 12%.
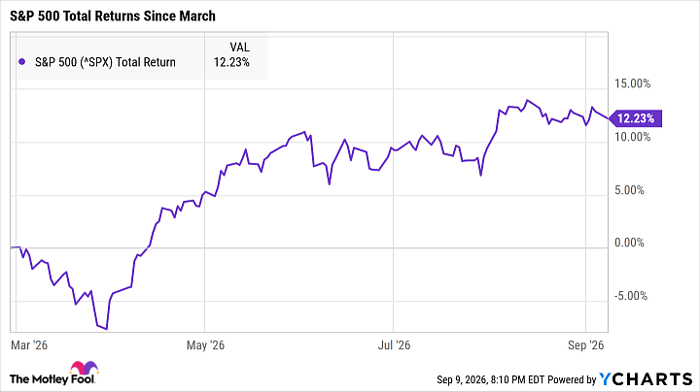
^SPX data by YCharts
Because the market can be so unpredictable in the short term, trying to time it effectively is nearly impossible. Even if the market crashes later this year, history has proven time and again that it's far safer to simply ride out the storm and stay invested for the long haul.
Say you invested in an S&P 500 exchange-traded fund (ETF) in January 2000. The market was soaring, investors were excited about the internet and its growth potential, and tech stocks were seemingly unstoppable. Then, just two months later, the dot-com bubble popped and sent stocks careening into a two-year bear market.
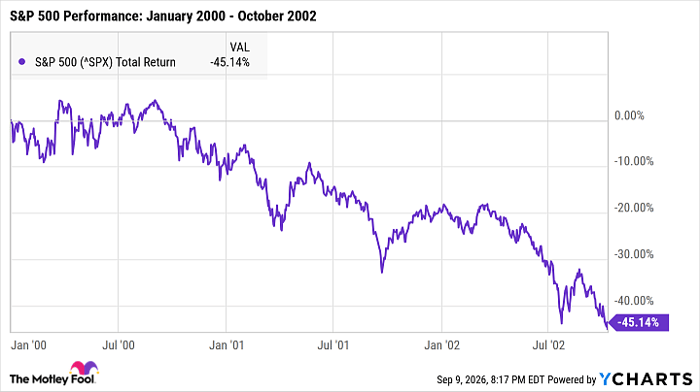
^SPX data by YCharts
At the time, it may have seemed like a terrible mistake to invest in the stock market. It would take years for the S&P 500 to reach a new all-time high, and shortly after it did, the Great Recession began, sending stocks into a tailspin.
However, investors who stuck it out would have earned total returns of more than 750% by today. If you had invested $10,000 in an S&P 500 ETF in January 2000 and didn't contribute another dollar after that, you would have about $85,000 by now.
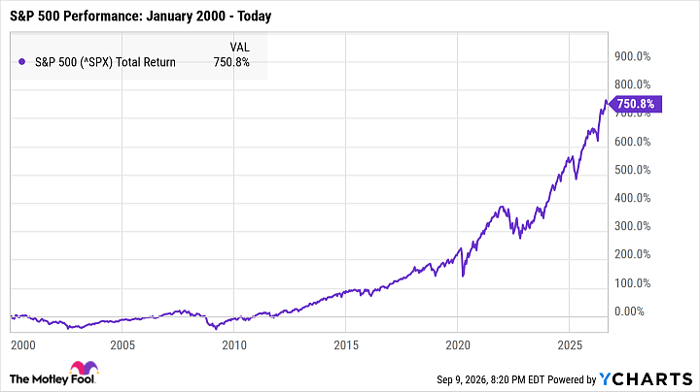
^SPX data by YCharts
One major caveat to consider before you invest
If history proves just one thing, it's that time in the market beats timing the market. The caveat, however, is that it's crucial to invest in quality stocks that are strong enough to survive a bear market or recession.
During the dot-com bubble, countless tech stocks crashed hard and never recovered. The Great Recession saw many banks and other businesses flounder. The crypto market crash in 2022 wiped out trillions of dollars in market value.
But the strongest stocks have survived all of these challenges and more. Despite losing nearly 80% of its value during the dot-com bear market, the Nasdaq has soared by more than 545% since January 2000. Many individual stocks have fared even better, rising from the ashes of the dot-com bust to become industry-leading juggernauts.
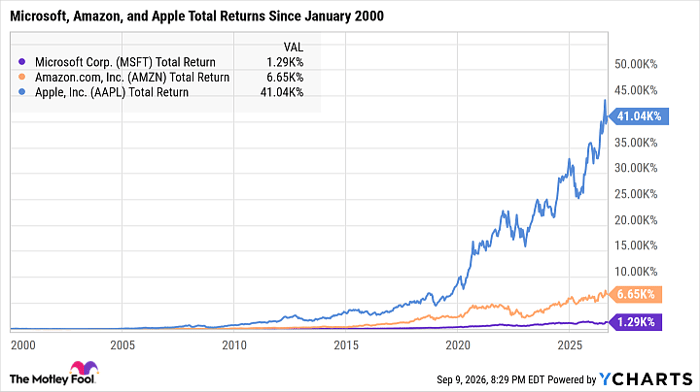
MSFT Total Return Level data by YCharts
The investments you choose will make or break your portfolio, especially during a bear market or recession. While nothing is guaranteed when investing, the safest investments are those with healthy underlying business fundamentals.
Plenty of companies are ill-prepared for a downturn, and those stocks are the riskiest buys right now. However, companies that are on firm financial footing, have a durable competitive advantage over peers, and are led by competent management teams have the best shot of thriving over time.
No matter what may be coming for the stock market, buying quality stocks and holding them for at least a few years -- or, ideally, decades -- is a historically proven strategy to protect your investments.
Should you buy stock in S&P 500 Index right now?
Before you buy stock in S&P 500 Index, consider this:
The Motley Fool Stock Advisor analyst team just identified what they believe are the 10 best stocks for investors to buy now… and S&P 500 Index wasn’t one of them. The 10 stocks that made the cut could produce monster returns in the coming years.
Consider when Netflix made this list on December 17, 2004... if you invested $1,000 at the time of our recommendation, you’d have $417,413!* Or when Nvidia made this list on April 15, 2005... if you invested $1,000 at the time of our recommendation, you’d have $1,341,294!*
Now, it’s worth noting Stock Advisor’s total average return is 950% — a market-crushing outperformance compared to 210% for the S&P 500. Don't miss the latest top 10 list, available with Stock Advisor, and join an investing community built by individual investors for individual investors.
See the 10 stocks »
*Stock Advisor returns as of September 12, 2026.
Katie Brockman has no position in any of the stocks mentioned. The Motley Fool has no position in any of the stocks mentioned. The Motley Fool has a disclosure policy.
Recommended Articles


