


What History Reveals When the S&P 500 Sends Its Rarest Warning Signal
Key Points
The Shiller CAPE Ratio is a widely respected metric that has previously spiked before major stock market crashes.
Even if a stock market crash is coming, buying an S&P 500 index fund is usually a good bet for long-term investors.
The Vanguard S&P 500 ETF has delivered 15% annualized returns for the past 16 years.
- 10 stocks we like better than Vanguard S&P 500 ETF ›
Many investors are worried that the U.S. stock market is getting too expensive. A widely watched metric for the S&P 500 index (SNPINDEX: ^GSPC) valuation is the Shiller CAPE Ratio. By calculating cyclically adjusted price-to-earnings ("CAPE"), this metric is meant to be a more consistent way to compare how expensive or undervalued the S&P 500 might be over time, across all kinds of economic conditions.
As of Sept. 6, the CAPE Ratio is 41.18. That's its highest level since 1999-2000, right before the dot-com crash. The CAPE ratio doesn't exceed 30 very often. But when it does, a stock market crash often follows. The first time the CAPE Ratio exceeded 30 was in 1929, right before the Great Depression.
Missed Nvidia in 2009? This Rare Signal Is Flashing Again. In 2009, a "Double Down" signal flashed for a little-known chipmaker called Nvidia. For the first time in years, that same "Total Conviction" signal is flashing for a company 1/100th the size of Nvidia. Continue »
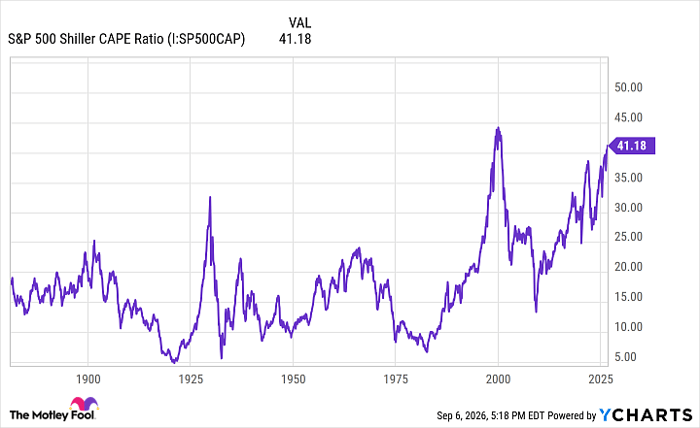
S&P 500 Shiller CAPE Ratio data by YCharts
Seeing the S&P 500 index at such high valuations, as indicated by the CAPE Ratio, can be seen as a rare warning signal for investors. But does this mean you should sell your stocks, change your portfolio allocations, or stop investing altogether?
No. The CAPE Ratio is well-regarded and worth watching, but like any other stock market metric, it's not 100% guaranteed to predict the future. And even if a stock market crash is coming soon, now could still be a good time to buy if you're a long-term investor.
Let's look at what long-term investors should do if they're worried about high valuations of the S&P 500 -- and why the answer might be "nothing."

Image source: Getty Images.
Don't try to time the market
It's understandable that savvy investors would be concerned about metrics like the CAPE Ratio. But try not to overreact. High valuations of the S&P 500 don't automatically mean that the stock market will crash anytime soon. Most of the time, buy-and-hold investors do better than investors who try to "time the market" by saying to themselves that "stocks are too expensive" or "now is a bad time to buy."
Fidelity research has found that even when stock prices are at all-time highs, this is often a better time to buy stocks. Since 1950, average total returns for the S&P 500 were slightly higher in the 12 months following an all-time high compared to other 12-month periods. High stock prices are often a sign that the economy is growing strongly and that investors are optimistic about the future -- and will keep buying stocks.
Remember, the Vanguard S&P 500 ETF (NYSEMKT: VOO) has delivered average annual returns of about 15% since the fund's inception 16 years ago. That includes the 2022 bear market and crises like the COVID-19 pandemic.
Over an even longer time frame, the S&P 500 has delivered annualized returns of 10% per year since 1928. That includes all the big world-changing crises and crashes along the way in the past 98 years. Bad news happens, but panic is the enemy of wealth-building. Long-term investors who keep calm and hold onto their stocks are likely to keep winning.
Why you should buy stocks, even with high valuations
The risk of missing out on future stock market gains is often bigger than the benefits of avoiding a stock market downturn. The CAPE Ratio doesn't have to be something to fear. With a long-term investment time horizon of five to 10 years or more, most investors are likely to be better off by just continuing to buy and hold a diversified portfolio of stocks.
Low-cost index funds like the Vanguard S&P 500 ETF can be an easy way to do this. Leave your money alone to go through the inevitable short-term ups and downs, and you're likely to see strong returns over time.
Should you buy stock in Vanguard S&P 500 ETF right now?
Before you buy stock in Vanguard S&P 500 ETF, consider this:
The Motley Fool Stock Advisor analyst team just identified what they believe are the 10 best stocks for investors to buy now… and Vanguard S&P 500 ETF wasn’t one of them. The 10 stocks that made the cut could produce monster returns in the coming years.
Consider when Netflix made this list on December 17, 2004... if you invested $1,000 at the time of our recommendation, you’d have $414,015!* Or when Nvidia made this list on April 15, 2005... if you invested $1,000 at the time of our recommendation, you’d have $1,385,459!*
Now, it’s worth noting Stock Advisor’s total average return is 960% — a market-crushing outperformance compared to 213% for the S&P 500. Don't miss the latest top 10 list, available with Stock Advisor, and join an investing community built by individual investors for individual investors.
See the 10 stocks »
*Stock Advisor returns as of September 9, 2026.
Ben Gran has no position in any of the stocks mentioned. The Motley Fool has positions in and recommends Vanguard S&P 500 ETF. The Motley Fool has a disclosure policy.
Recommended Articles


